 10
10peptides
spectra
0.256 | 0.260
0.056 | 0.078
0.022 | 0.038
0.639 | 0.646
0.000 | 0.000
0.000 | 0.000
0.000 | 0.000
0.000 | 0.000
| Plot | Mito | Lyso | Perox | ER | Golgi | PM | Cytosol | Nucleus | |||||
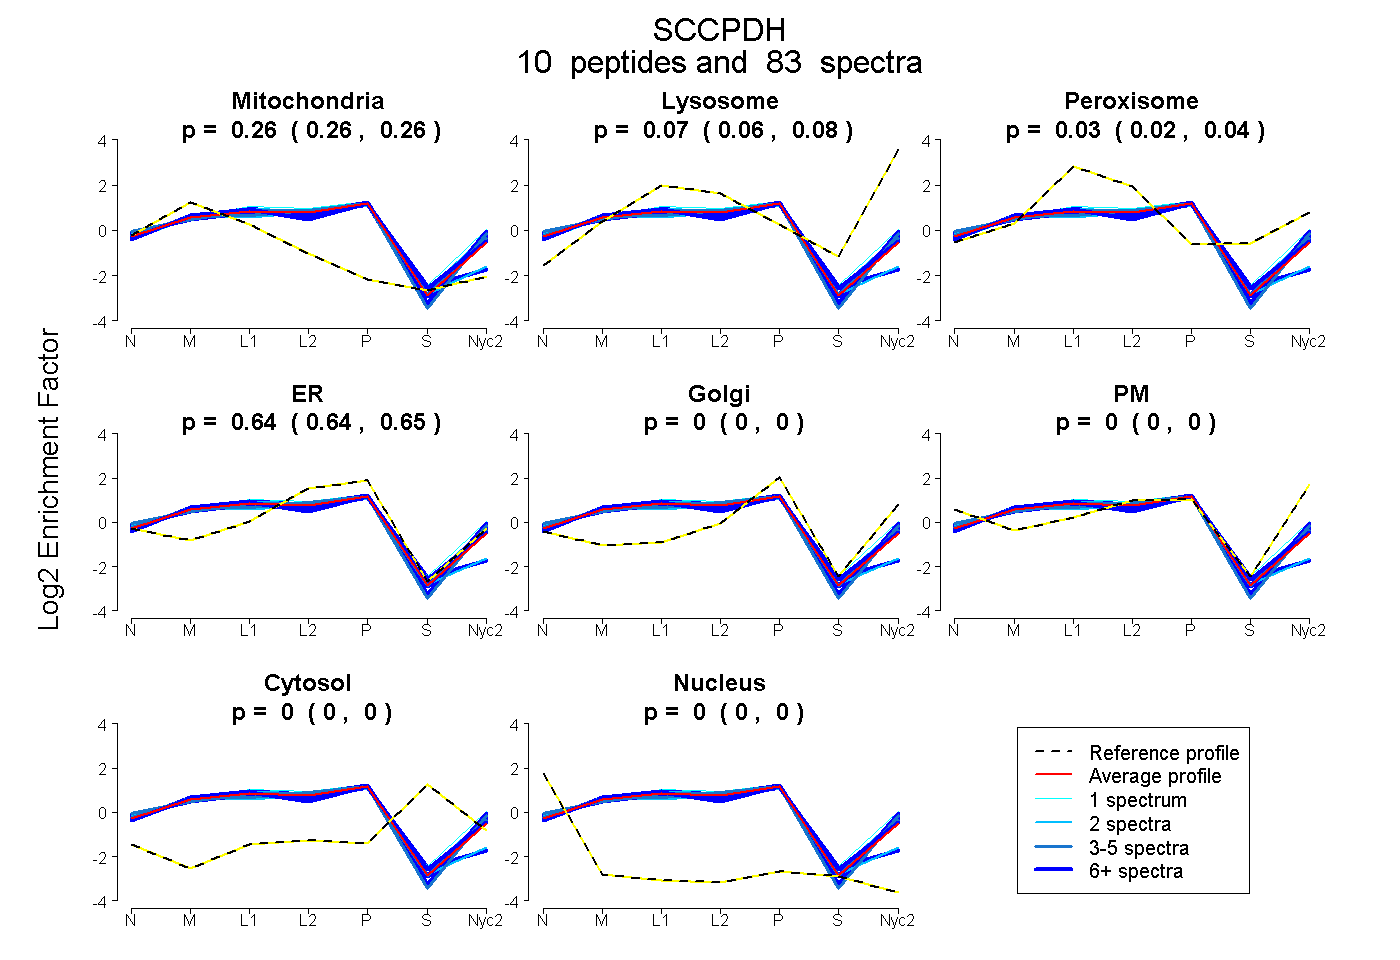
| Expt A |
10 peptides |
83 spectra |
|
0.258 0.256 | 0.260 |
0.068 0.056 | 0.078 |
0.031 0.022 | 0.038 |
0.642 0.639 | 0.646 |
0.000 0.000 | 0.000 |
0.000 0.000 | 0.000 |
0.000 0.000 | 0.000 |
0.000 0.000 | 0.000 |
| 2 spectra, FYGEPVVK | 0.261 | 0.124 | 0.000 | 0.577 | 0.000 | 0.038 | 0.000 | 0.000 | ||
| 6 spectra, WPVSYCR | 0.279 | 0.101 | 0.027 | 0.592 | 0.000 | 0.000 | 0.000 | 0.000 | ||
| 19 spectra, EQMASEQSSR | 0.234 | 0.143 | 0.000 | 0.590 | 0.000 | 0.033 | 0.000 | 0.000 | ||
| 4 spectra, SAIYGFGDK | 0.219 | 0.012 | 0.084 | 0.571 | 0.000 | 0.113 | 0.000 | 0.000 | ||
| 3 spectra, LQQVLEK | 0.230 | 0.052 | 0.000 | 0.574 | 0.000 | 0.144 | 0.000 | 0.000 | ||
| 2 spectra, LNQHGIQFSVISSSEV | 0.333 | 0.000 | 0.027 | 0.640 | 0.000 | 0.000 | 0.000 | 0.000 | ||
| 1 spectrum, ELNSYAIPFLGSDMSVVK | 0.175 | 0.172 | 0.068 | 0.585 | 0.000 | 0.000 | 0.000 | 0.000 | ||
| 14 spectra, LPWAVAGR | 0.242 | 0.127 | 0.000 | 0.609 | 0.000 | 0.022 | 0.000 | 0.000 | ||
| 12 spectra, ATLVLNCVGPYR | 0.346 | 0.000 | 0.040 | 0.614 | 0.000 | 0.000 | 0.000 | 0.000 | ||
| 20 spectra, GGGVFTPGAAFSR | 0.238 | 0.066 | 0.014 | 0.625 | 0.000 | 0.057 | 0.000 | 0.000 |
| Plot | Mito | Lyso or Perox | ER | Golgi | PM | Cytosol | Nucleus | ||||||
| Expt B |
9 peptides |
31 spectra |
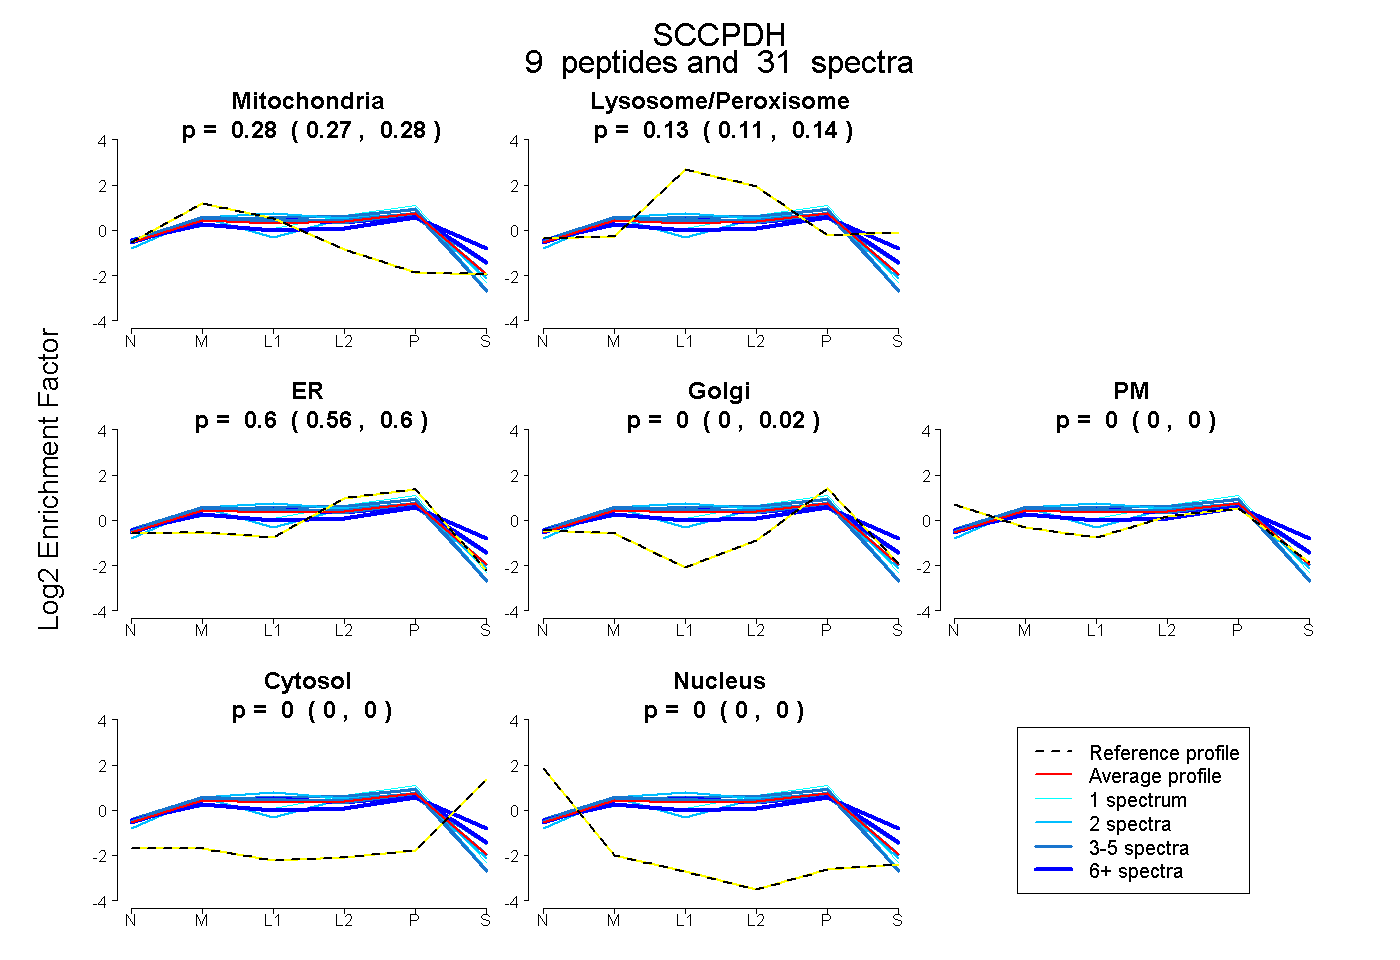 |
0.276 0.265 | 0.281 |
0.128 0.114 | 0.144 |
0.596 0.563 | 0.605 |
0.000 0.000 | 0.017 |
0.000 0.000 | 0.000 |
0.000 0.000 | 0.000 |
0.000 0.000 | 0.000 |
|||
| Plot | Lyso | Other | |||||||||||
| Expt C |
12 peptides |
235 spectra |
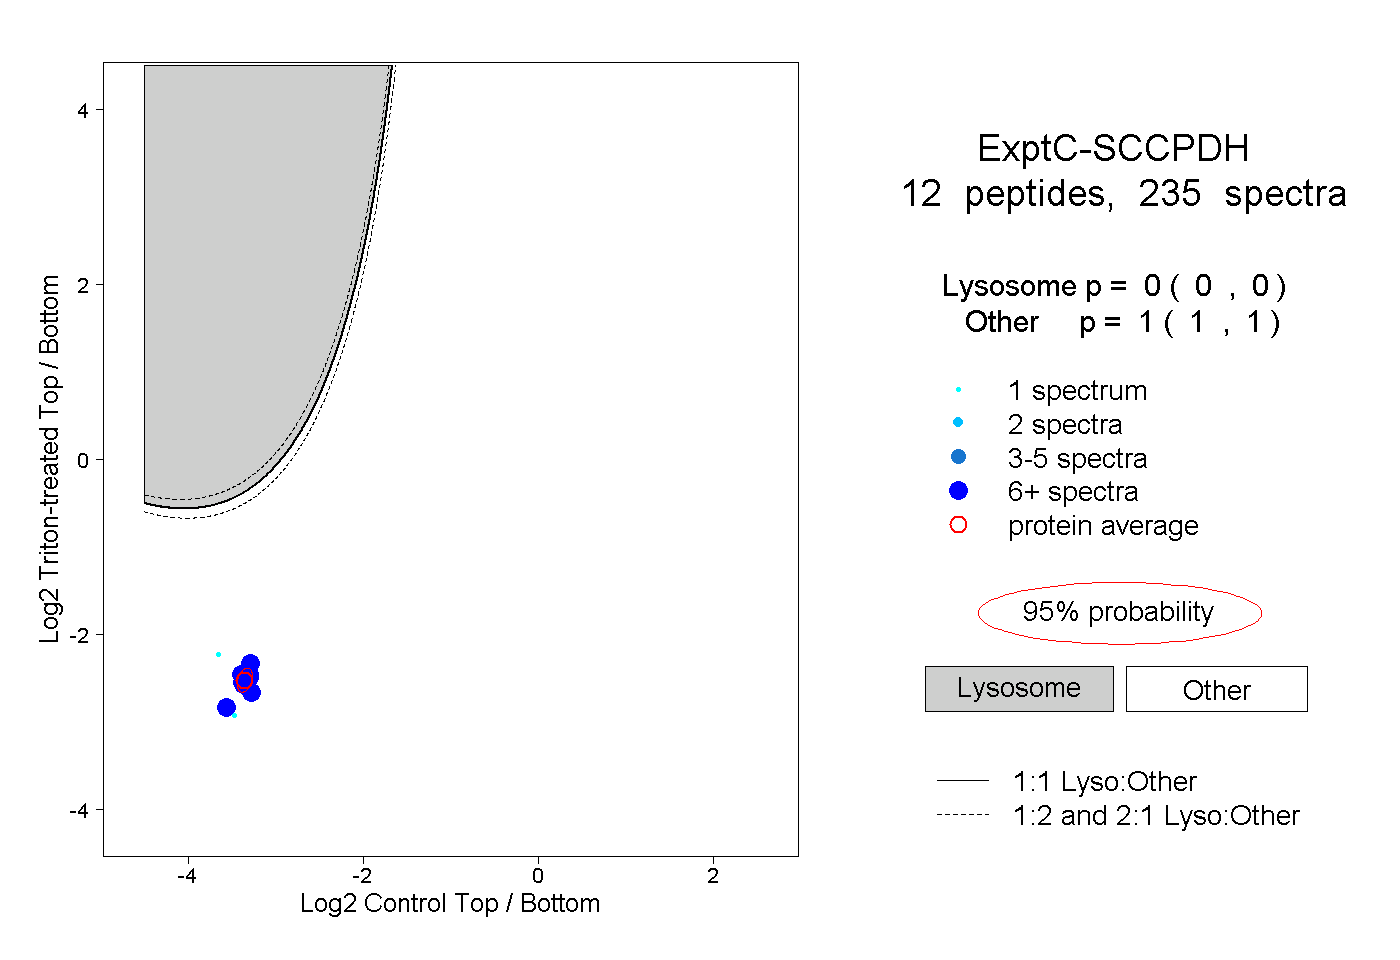 |
0.000 0.000 | 0.000 |
1.000 1.000 | 1.000 |
||||||||
| Plot | Lyso | Other | |||||||||||
| Expt D |
7 peptides |
19 spectra |
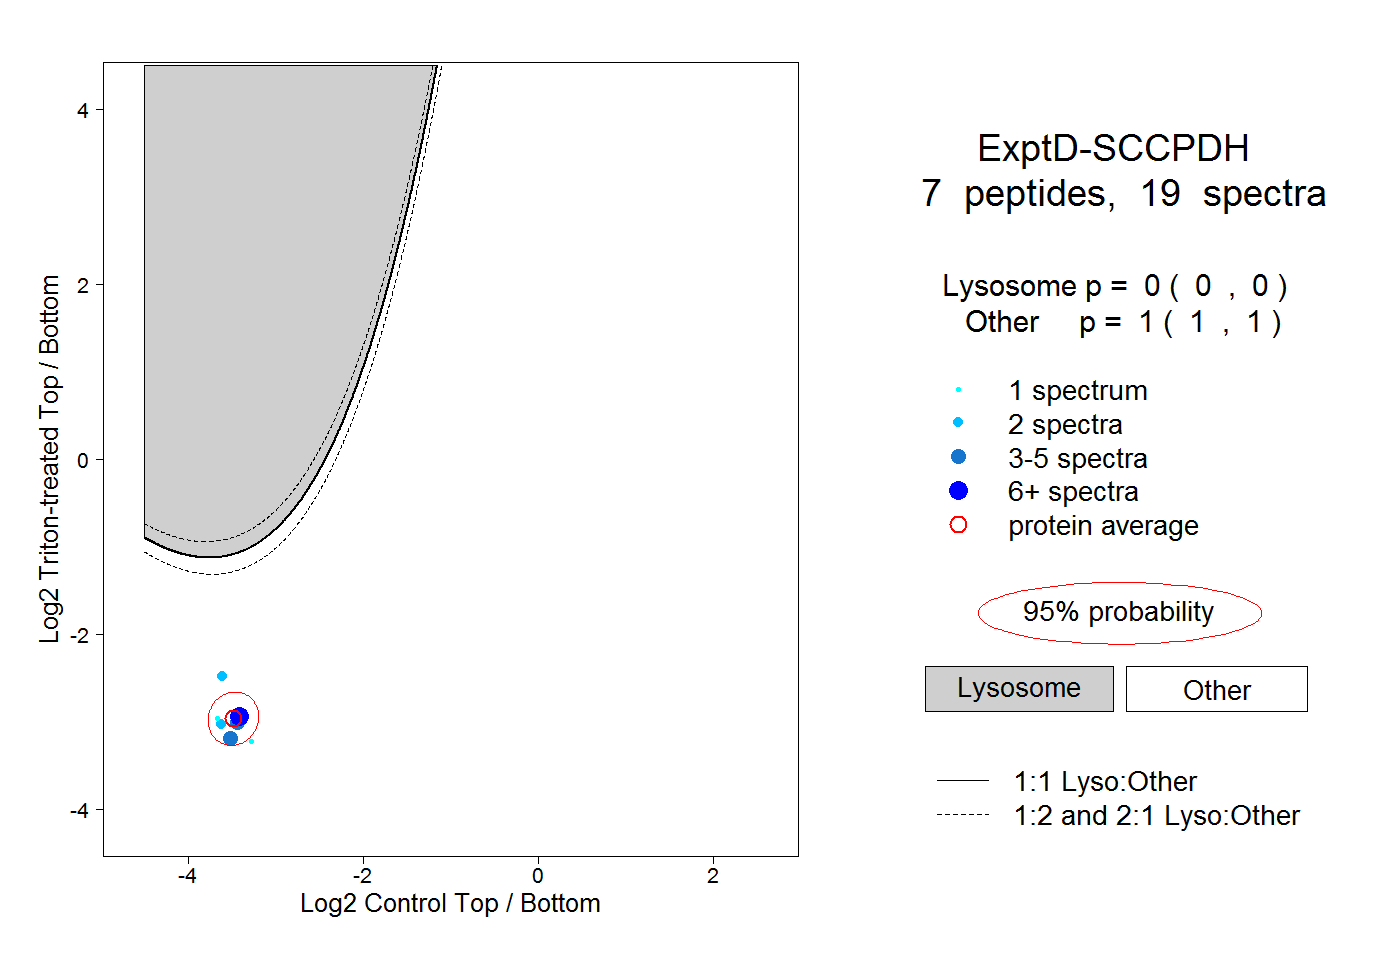 |
0.000 0.000 | 0.000 |
1.000 1.000 | 1.000 |