 2
2peptides
spectra
0.000 | 0.000
0.236 | 0.287
0.000 | 0.000
0.000 | 0.000
0.351 | 0.397
0.319 | 0.394
0.000 | 0.000
0.000 | 0.000
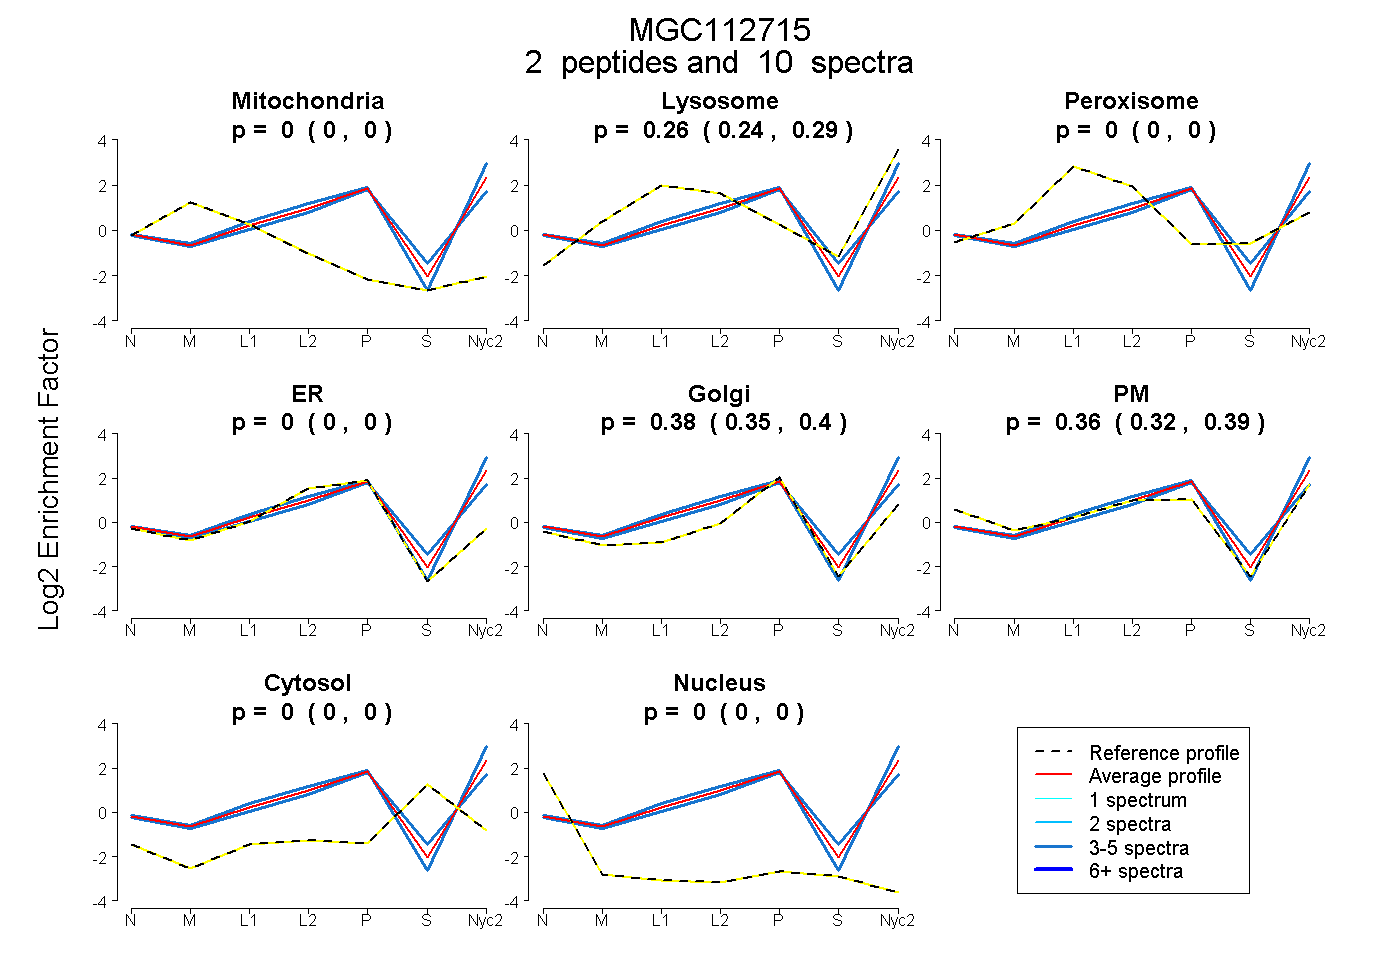
| Plot | Mito | Lyso | Perox | ER | Golgi | PM | Cytosol | Nucleus | |||||
| Expt A |
2 peptides |
10 spectra |
|
0.000 0.000 | 0.000 |
0.264 0.236 | 0.287 |
0.000 0.000 | 0.000 |
0.000 0.000 | 0.000 |
0.376 0.351 | 0.397 |
0.360 0.319 | 0.394 |
0.000 0.000 | 0.000 |
0.000 0.000 | 0.000 |
| 5 spectra, TWFLSSR | 0.000 | 0.274 | 0.000 | 0.000 | 0.204 | 0.522 | 0.000 | 0.000 | ||
| 5 spectra, TRPPLSYVAQR | 0.000 | 0.248 | 0.000 | 0.026 | 0.497 | 0.208 | 0.022 | 0.000 |
| Plot | Lyso | Other | |||||||||||
| Expt C |
4 peptides |
7 spectra |
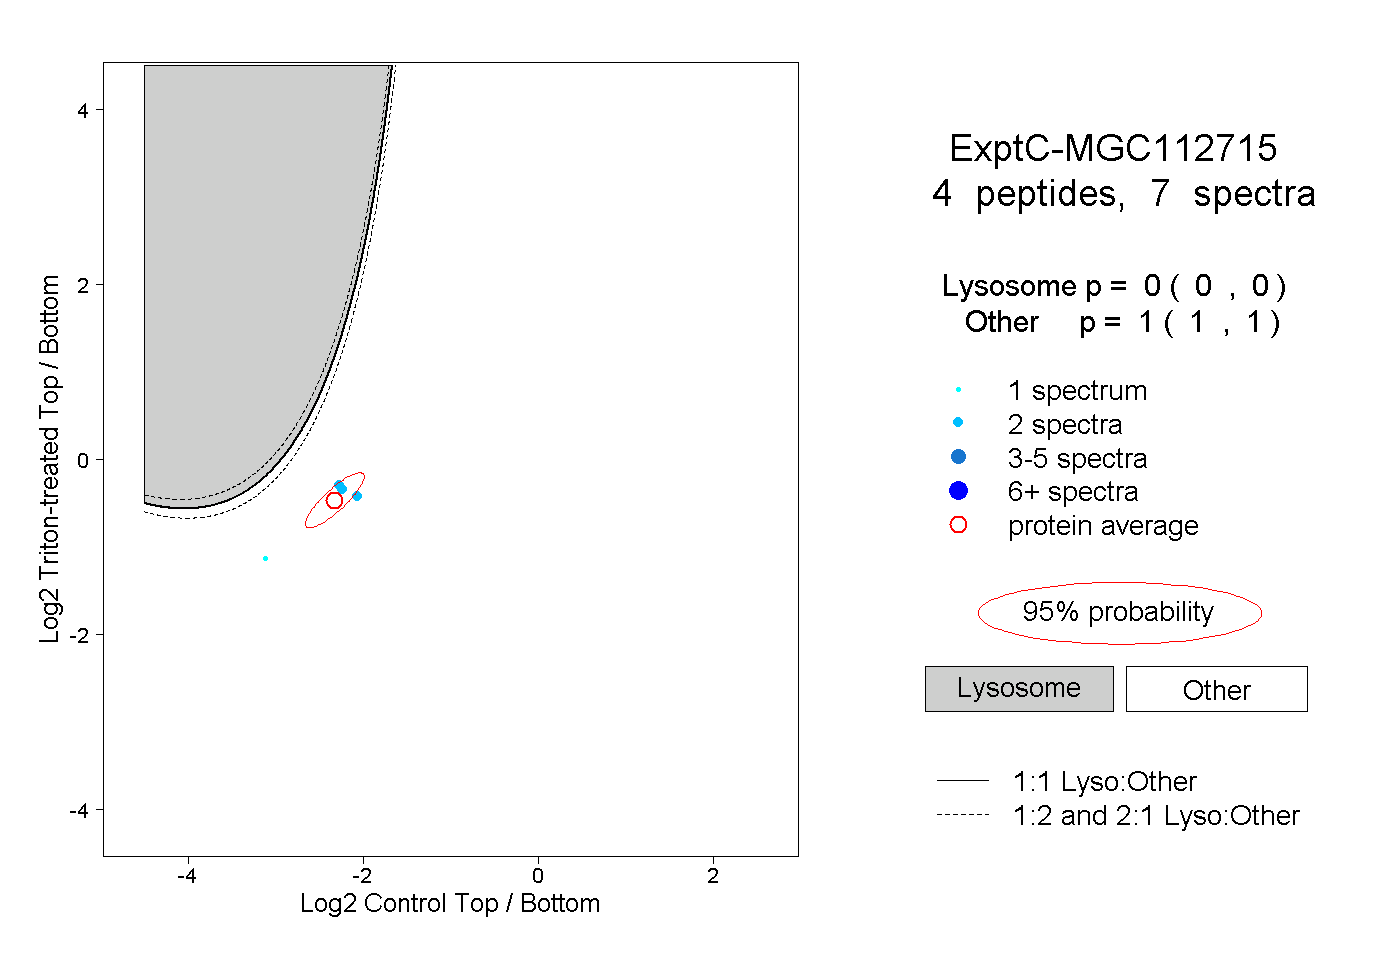 |
0.000 0.000 | 0.000 |
1.000 1.000 | 1.000 |