 2
2peptides
spectra
0.000 | 0.234
0.000 | 0.751
0.000 | 0.512
0.000 | 0.287
0.000 | 0.226
0.000 | 0.496
0.000 | 0.170
0.000 | 0.026
1peptide
spectra
1.000 | 1.000
0.000 | 0.000
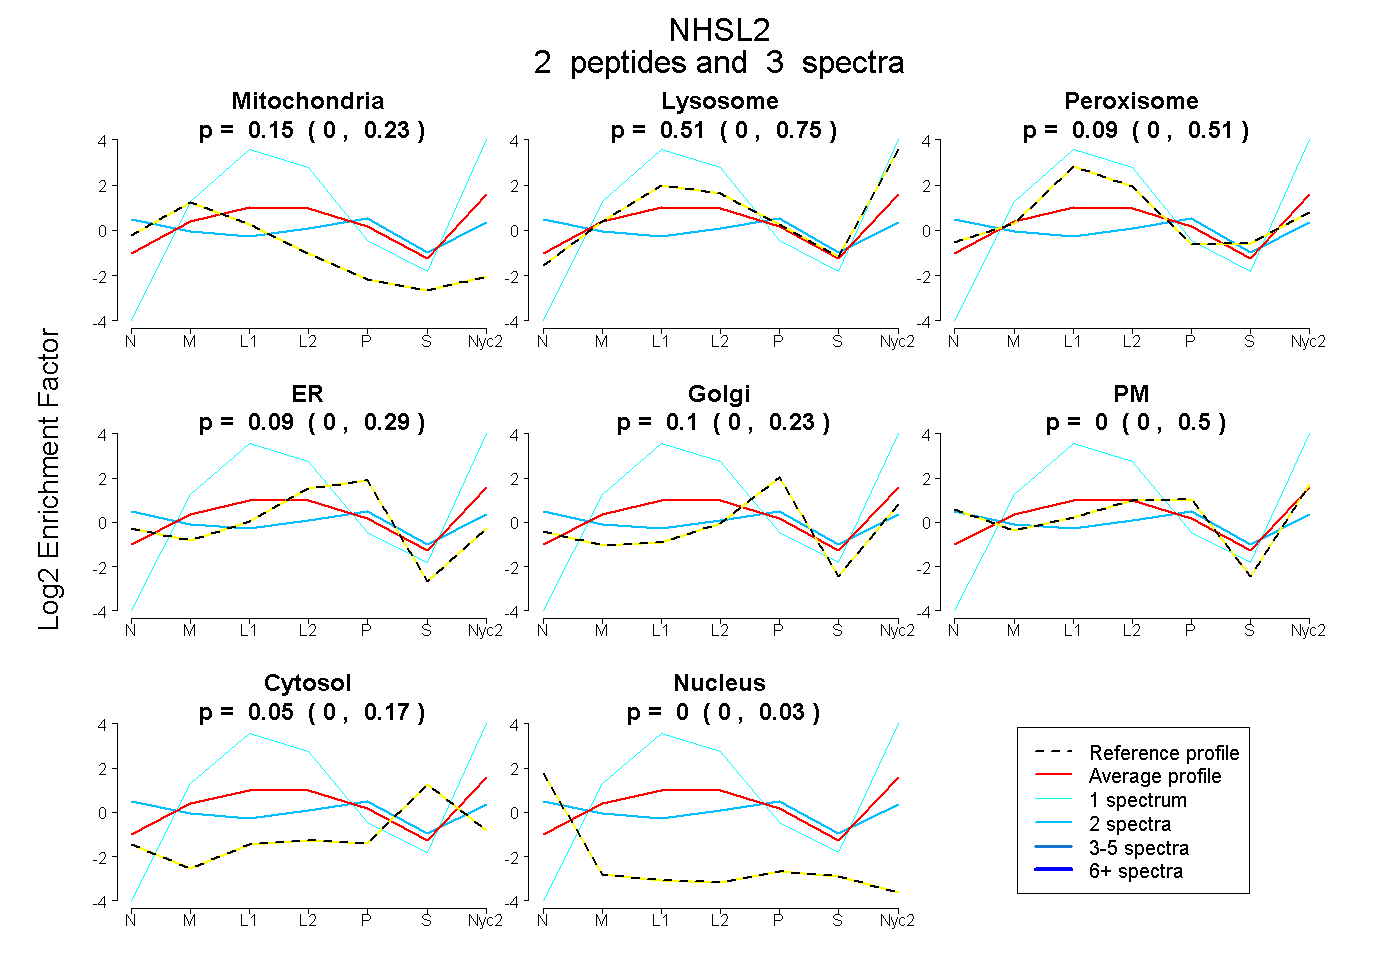
| Plot | Mito | Lyso | Perox | ER | Golgi | PM | Cytosol | Nucleus | |||||
| Expt A |
2 peptides |
3 spectra |
|
0.151 0.000 | 0.234 |
0.513 0.000 | 0.751 |
0.091 0.000 | 0.512 |
0.088 0.000 | 0.287 |
0.105 0.000 | 0.226 |
0.000 0.000 | 0.496 |
0.053 0.000 | 0.170 |
0.000 0.000 | 0.026 |
||
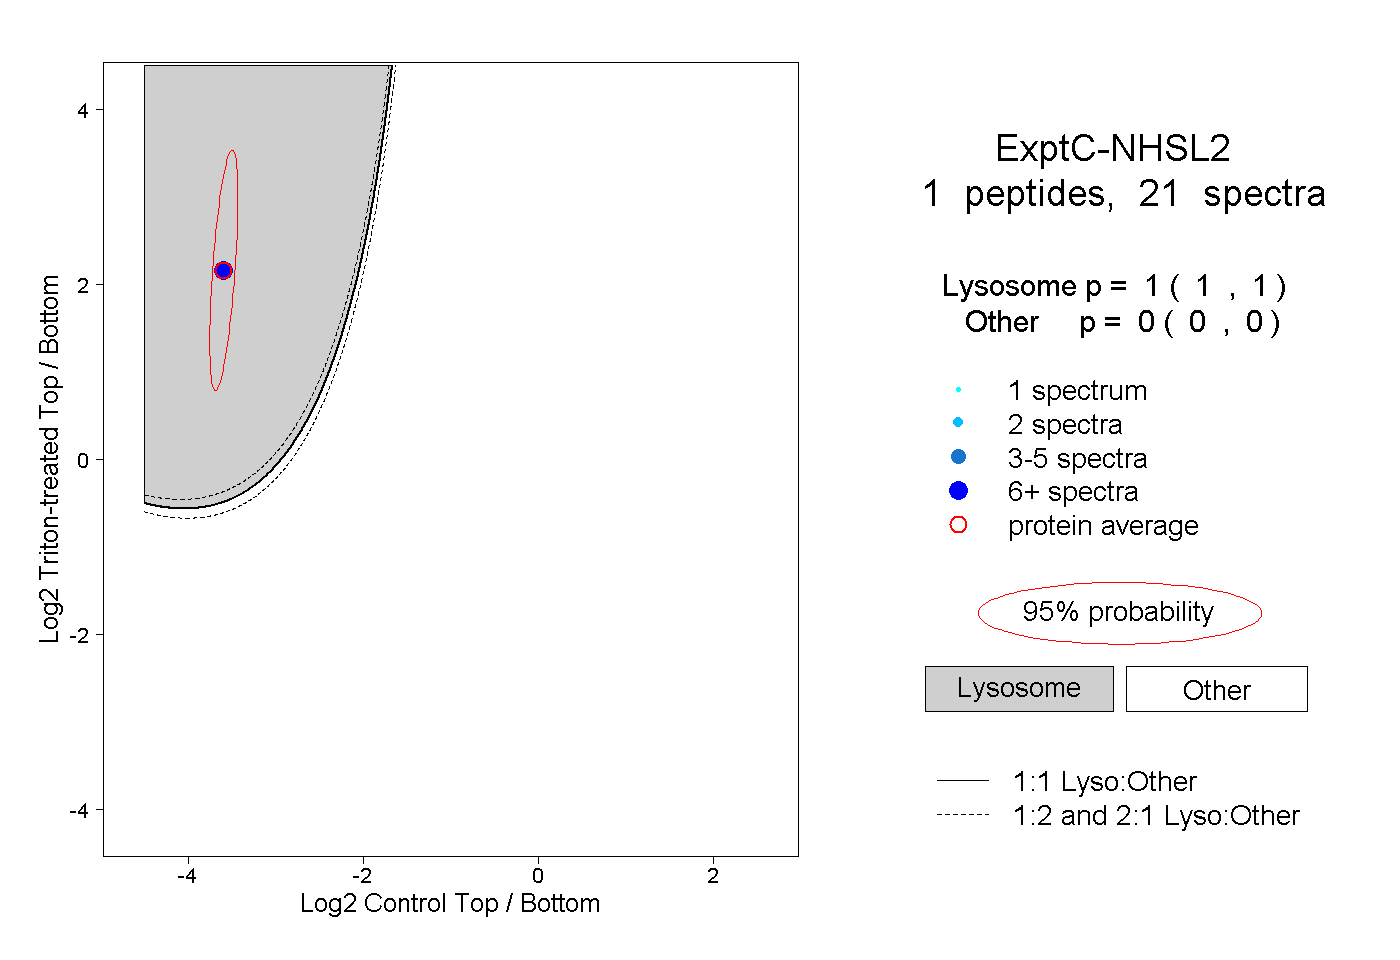
| Plot | Lyso | Other | |||||||||||
| Expt C |
1 peptide |
21 spectra |
|
1.000 1.000 | 1.000 |
0.000 0.000 | 0.000 |