 2
2peptides
spectra
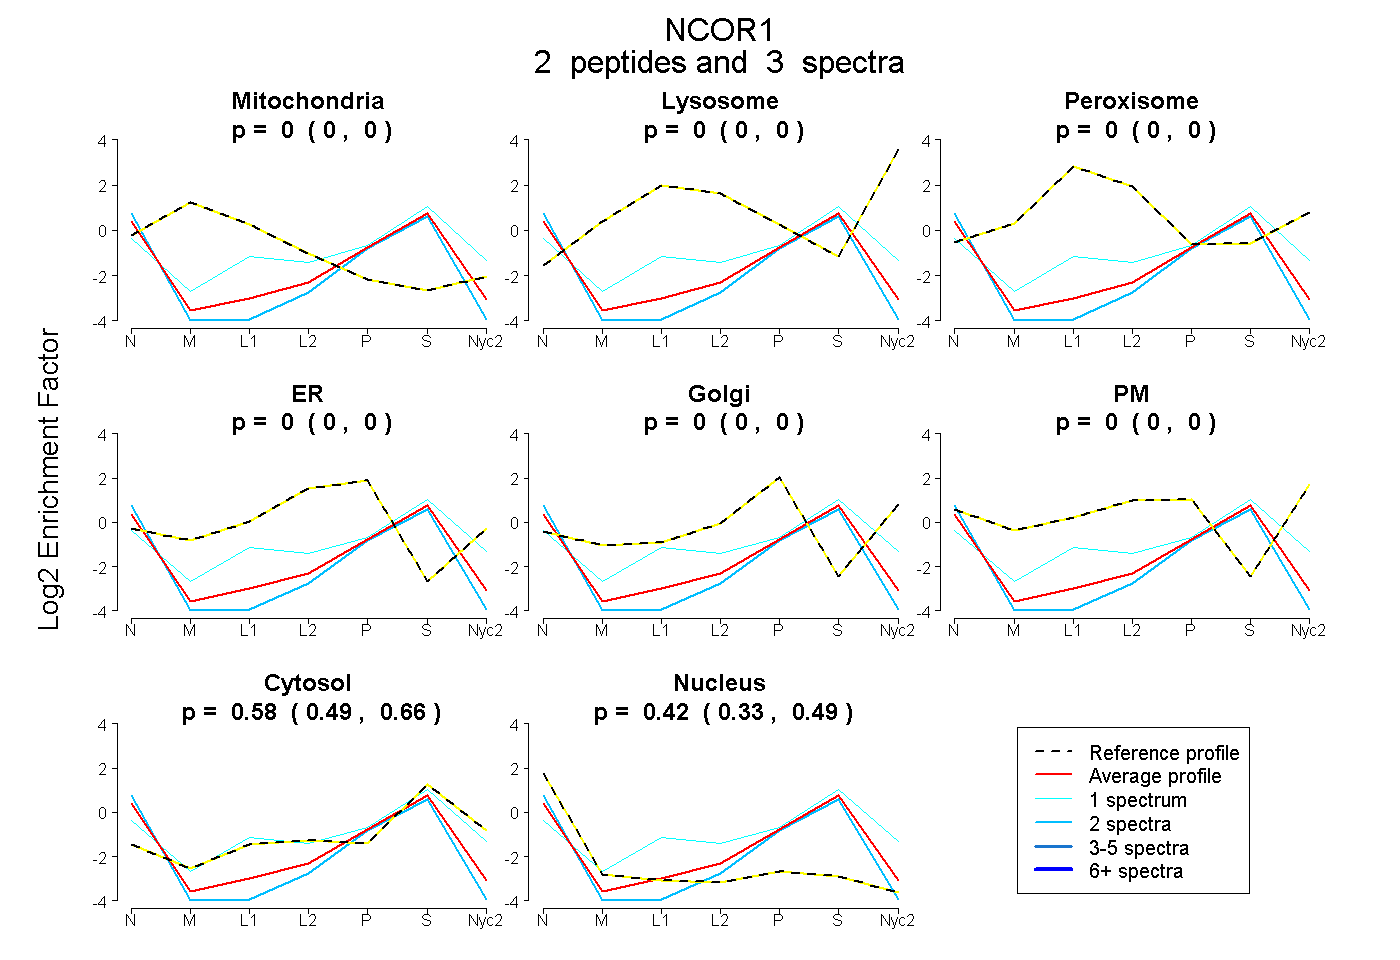
0.000 | 0.000
0.000 | 0.000
0.000 | 0.000
0.000 | 0.000
0.000 | 0.000
0.000 | 0.000
0.494 | 0.659
0.327 | 0.494
| Plot | Mito | Lyso | Perox | ER | Golgi | PM | Cytosol | Nucleus | |||||
| Expt A |
2 peptides |
3 spectra |
|
0.000 0.000 | 0.000 |
0.000 0.000 | 0.000 |
0.000 0.000 | 0.000 |
0.000 0.000 | 0.000 |
0.000 0.000 | 0.000 |
0.000 0.000 | 0.000 |
0.580 0.494 | 0.659 |
0.420 0.327 | 0.494 |
| 1 spectrum, YDQLMEAWEK | 0.000 | 0.000 | 0.000 | 0.082 | 0.000 | 0.000 | 0.825 | 0.093 | ||
| 2 spectra, VSAAVLPLVHTLPEGLR | 0.000 | 0.000 | 0.000 | 0.000 | 0.000 | 0.000 | 0.421 | 0.579 |
| Plot | Lyso | Other | |||||||||||
| Expt C |
2 peptides |
4 spectra |
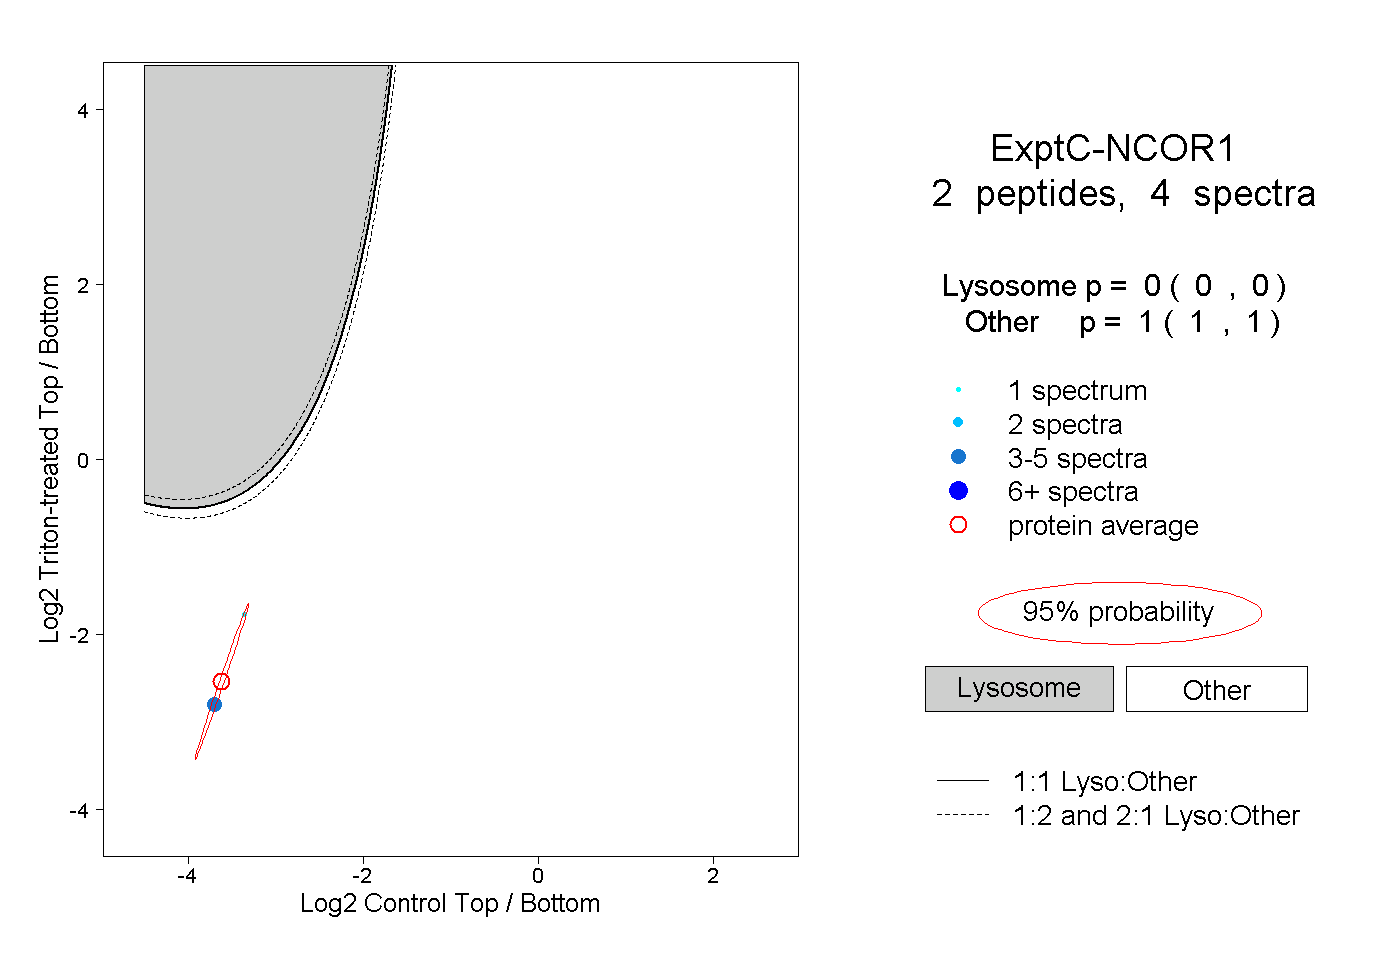 |
0.000 0.000 | 0.000 |
1.000 1.000 | 1.000 |