TPM1
[ENSRNOP00000054446]
Main page
| | | Plot |
Mito |
Lyso |
|
Perox |
ER |
Golgi |
PM |
Cytosol |
Nucleus |
|
| Expt A |
 11
11
peptides |
32
spectra |
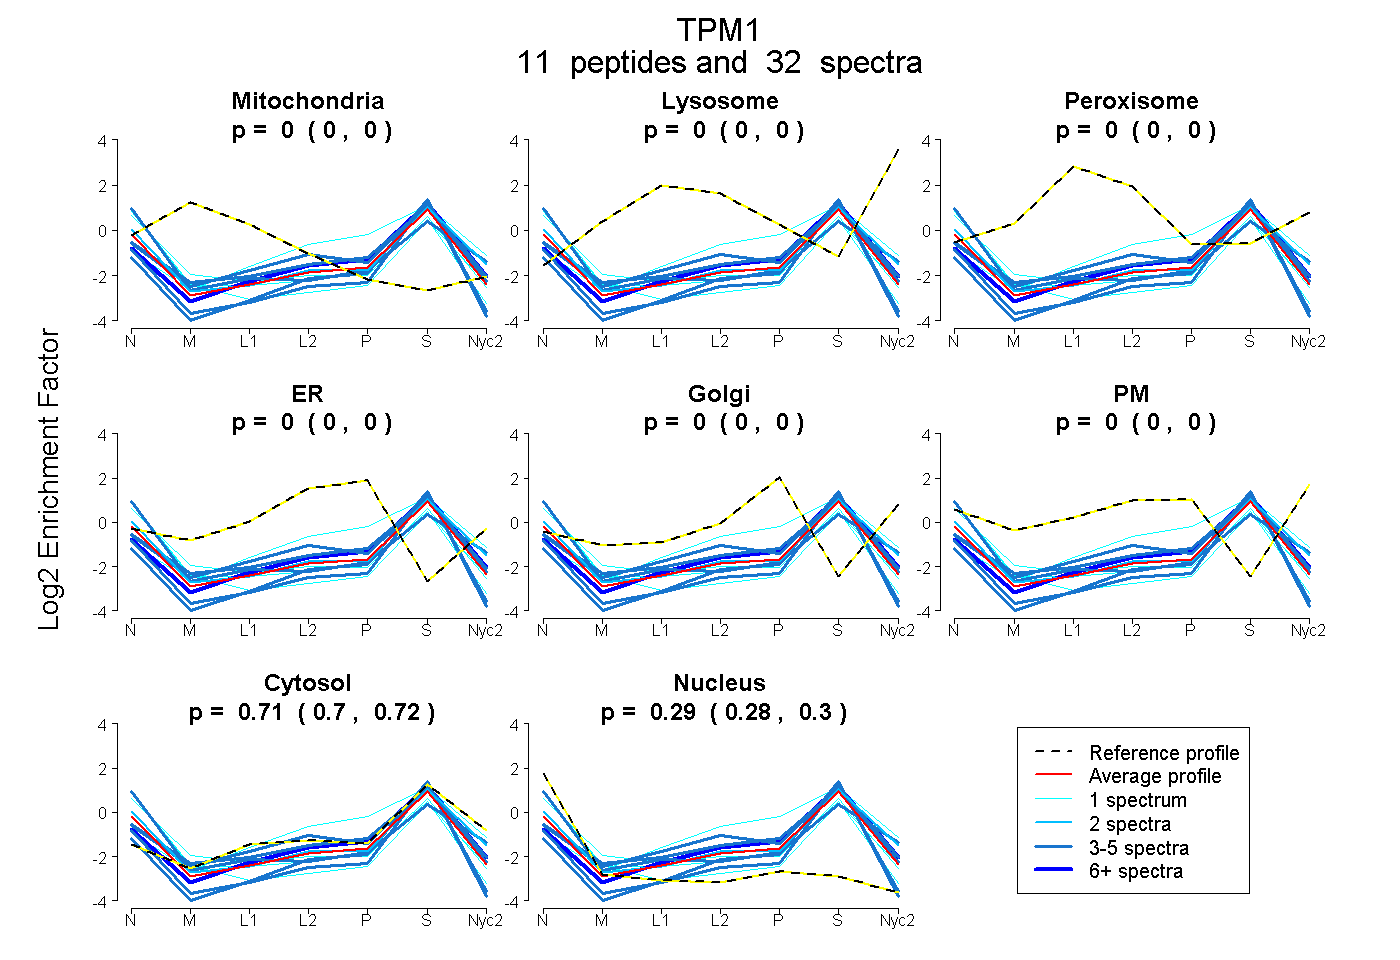 |
0.000
0.000 | 0.000 |
0.000
0.000 | 0.000 |
|
0.000
0.000 | 0.000 |
0.000
0.000 | 0.000 |
0.000
0.000 | 0.000 |
0.000
0.000 | 0.000 |
0.705
0.695 | 0.715 |
0.295
0.284 | 0.304 |
|
| | | Plot |
Mito |
|
Lyso or Perox |
|
ER |
Golgi |
PM |
Cytosol |
Nucleus |
|
| Expt B |
7
peptides |
10
spectra |
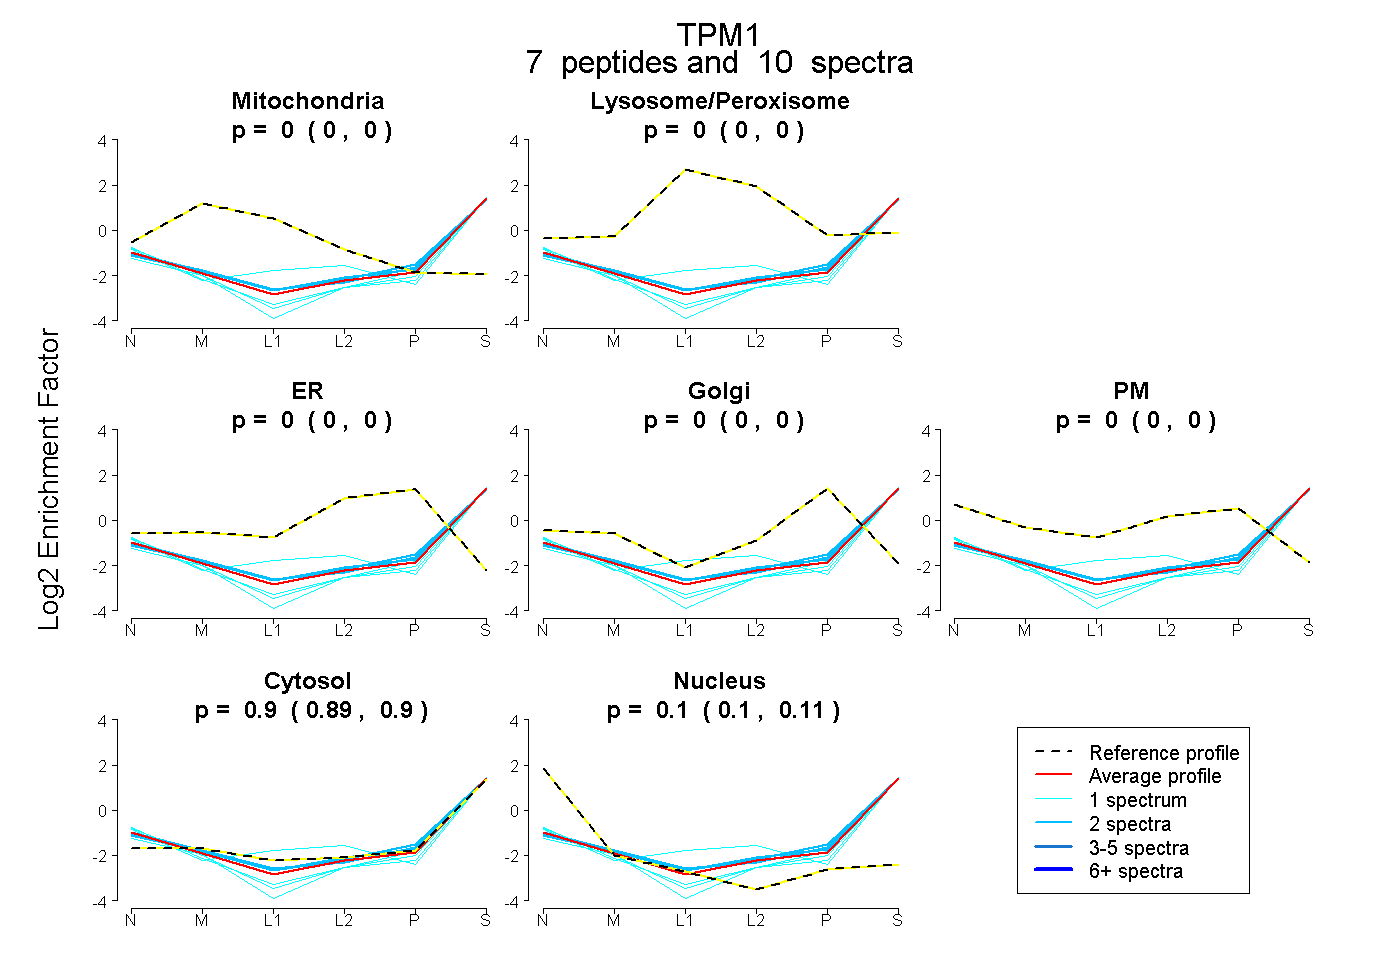 |
0.000
0.000 | 0.000 |
|
0.000
0.000 | 0.000 |
|
0.000
0.000 | 0.000 |
0.000
0.000 | 0.000 |
0.000
0.000 | 0.000 |
0.897
0.891 | 0.902 |
0.103
0.097 | 0.108 |
|
| | | Plot |
|
Lyso |
|
|
|
|
|
|
|
Other |
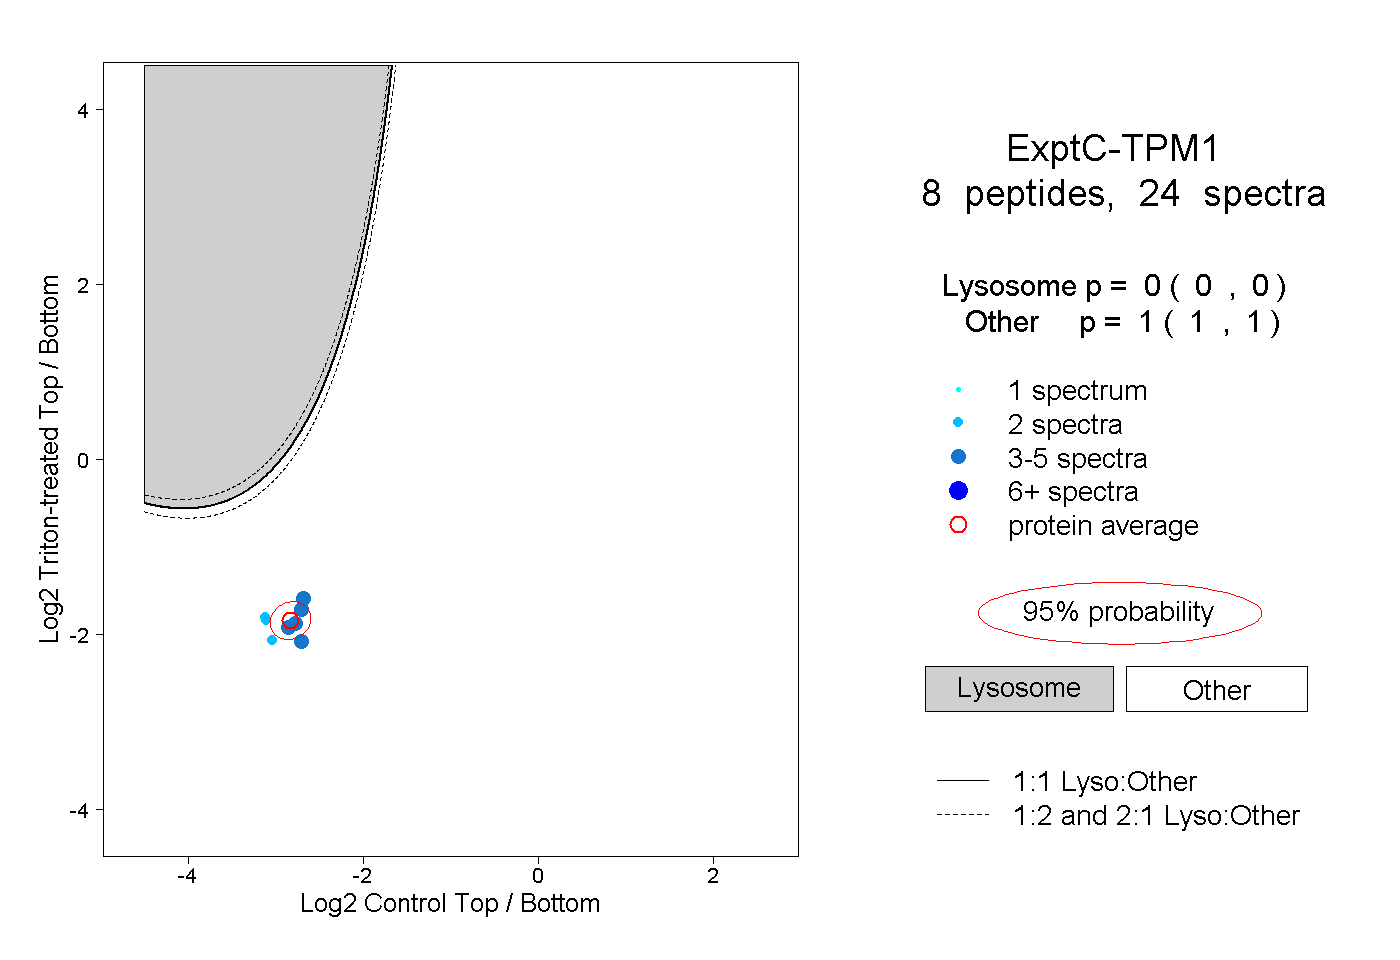
| Expt C |
8
peptides |
24
spectra |
 |
|
0.000
0.000 | 0.000 |
|
|
|
|
|
|
|
1.000
1.000 | 1.000 |
| | | Plot |
|
Lyso |
|
|
|
|
|
|
|
Other |
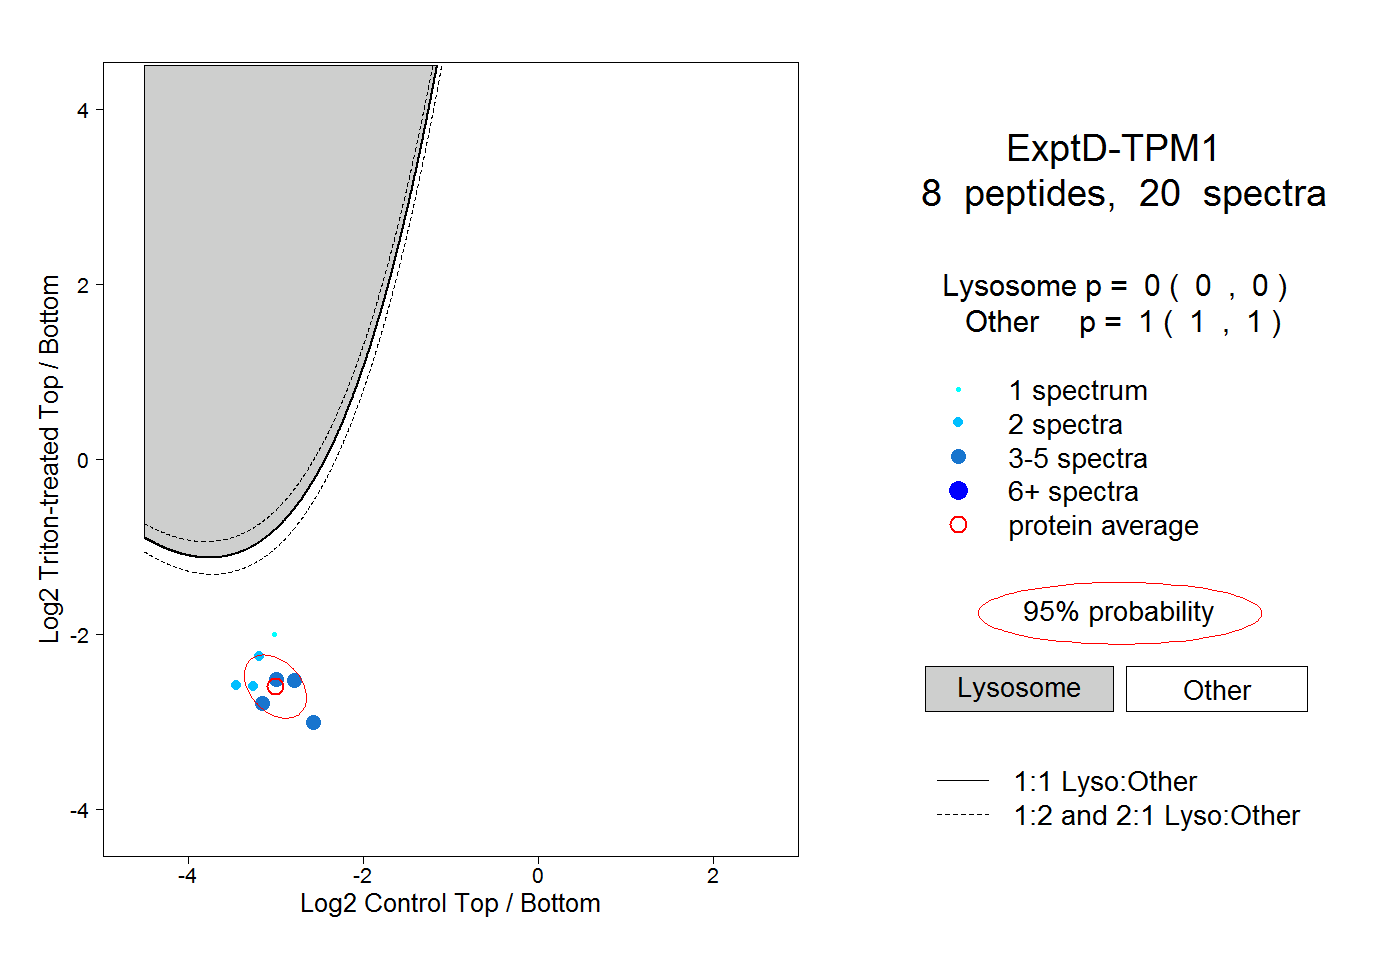
| Expt D |
8
peptides |
20
spectra |
 |
|
0.000
0.000 | 0.000 |
|
|
|
|
|
|
|
1.000
1.000 | 1.000 |
| 3 spectra, QLEEQLR |
|
0.000 |
|
|
|
|
|
|
|
1.000 |
| 2 spectra, LEEAEK |
|
0.000 |
|
|
|
|
|
|
|
1.000 |
| 2 spectra, SLQEQADAAEER |
|
0.000 |
|
|
|
|
|
|
|
1.000 |
| 3 spectra, SIDDLEEK |
|
0.000 |
|
|
|
|
|
|
|
1.000 |
| 3 spectra, LATALQK |
|
0.000 |
|
|
|
|
|
|
|
1.000 |
| 4 spectra, IQLVEEELDR |
|
0.000 |
|
|
|
|
|
|
|
1.000 |
| 2 spectra, ETAEADVASLNR |
|
0.000 |
|
|
|
|
|
|
|
1.000 |
| 1 spectrum, LVIIESDLER |
|
0.001 |
|
|
|
|
|
|
|
0.999 |