 11
11peptides
spectra
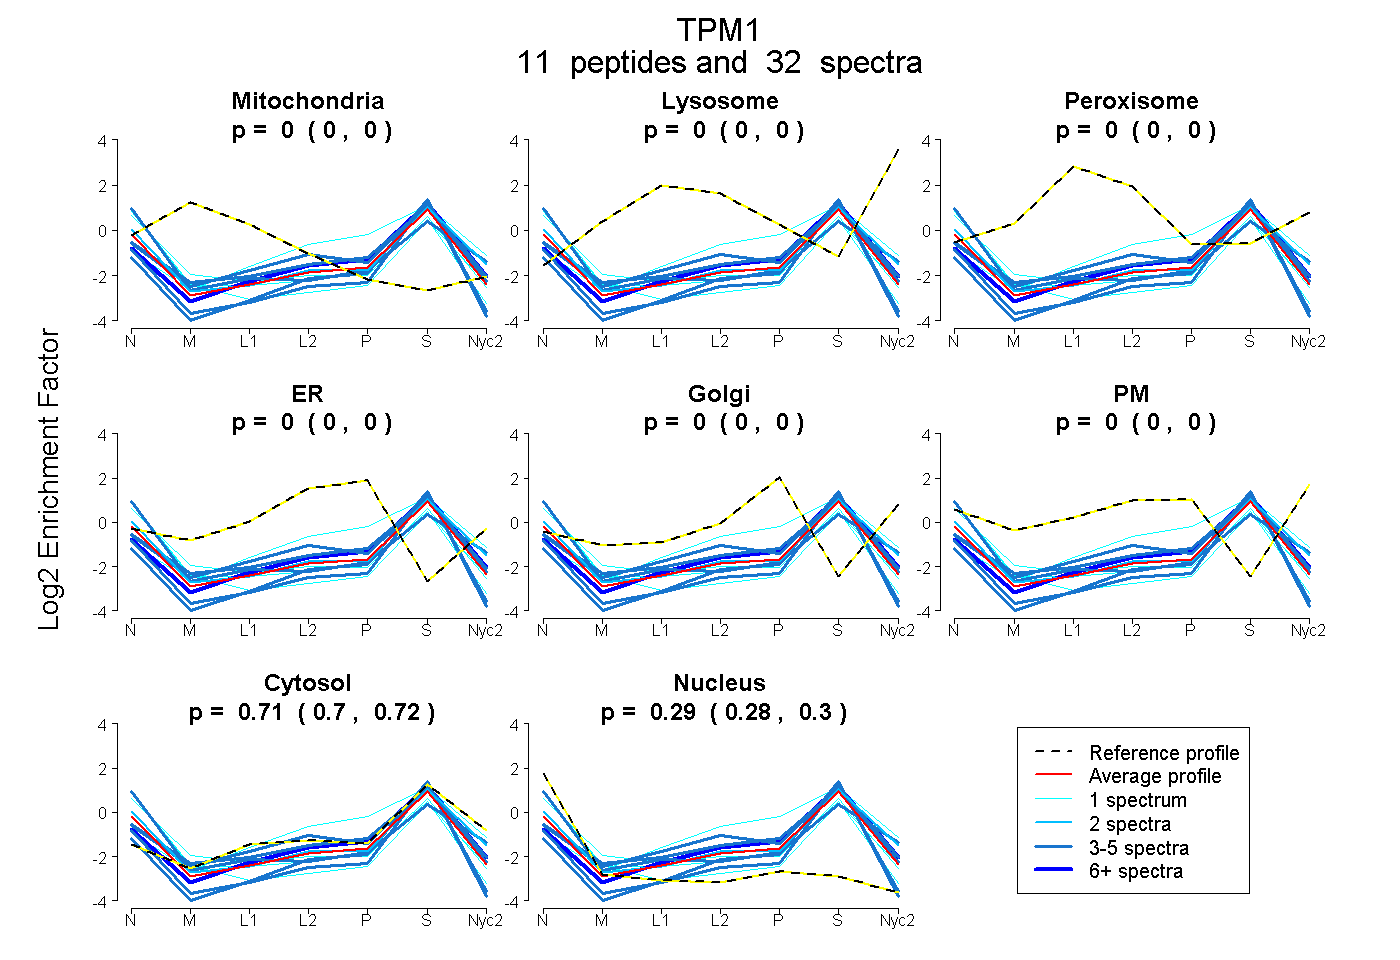
0.000 | 0.000
0.000 | 0.000
0.000 | 0.000
0.000 | 0.000
0.000 | 0.000
0.000 | 0.000
0.695 | 0.715
0.284 | 0.304
| Plot | Mito | Lyso | Perox | ER | Golgi | PM | Cytosol | Nucleus | |||||
| Expt A |
11 peptides |
32 spectra |
|
0.000 0.000 | 0.000 |
0.000 0.000 | 0.000 |
0.000 0.000 | 0.000 |
0.000 0.000 | 0.000 |
0.000 0.000 | 0.000 |
0.000 0.000 | 0.000 |
0.705 0.695 | 0.715 |
0.295 0.284 | 0.304 |
| 3 spectra, QLEEELR | 0.000 | 0.000 | 0.000 | 0.000 | 0.000 | 0.015 | 0.610 | 0.375 | ||
| 1 spectrum, AEDSLLAADETAAK | 0.000 | 0.000 | 0.000 | 0.000 | 0.000 | 0.000 | 0.489 | 0.511 | ||
| 1 spectrum, ATDAEADVASLNR | 0.004 | 0.000 | 0.000 | 0.000 | 0.000 | 0.000 | 0.593 | 0.403 | ||
| 1 spectrum, ALMAAEDK | 0.000 | 0.000 | 0.000 | 0.156 | 0.000 | 0.000 | 0.844 | 0.000 | ||
| 3 spectra, SLQEQADAAEER | 0.000 | 0.000 | 0.000 | 0.000 | 0.000 | 0.000 | 0.676 | 0.324 | ||
| 4 spectra, SIDDLEEK | 0.000 | 0.000 | 0.000 | 0.000 | 0.000 | 0.000 | 0.796 | 0.204 | ||
| 3 spectra, HIAEDADR | 0.000 | 0.000 | 0.000 | 0.000 | 0.000 | 0.000 | 0.845 | 0.155 | ||
| 2 spectra, TVTNNLK | 0.000 | 0.000 | 0.000 | 0.000 | 0.000 | 0.000 | 0.753 | 0.247 | ||
| 1 spectrum, AEADVASLNR | 0.000 | 0.000 | 0.000 | 0.000 | 0.000 | 0.000 | 0.510 | 0.490 | ||
| 9 spectra, ETAEADVASLNR | 0.000 | 0.000 | 0.000 | 0.000 | 0.000 | 0.000 | 0.820 | 0.180 | ||
| 4 spectra, LVIIESDLER | 0.000 | 0.000 | 0.000 | 0.000 | 0.000 | 0.000 | 0.633 | 0.367 |
| Plot | Mito | Lyso or Perox | ER | Golgi | PM | Cytosol | Nucleus | ||||||
| Expt B |
7 peptides |
10 spectra |
 |
0.000 0.000 | 0.000 |
0.000 0.000 | 0.000 |
0.000 0.000 | 0.000 |
0.000 0.000 | 0.000 |
0.000 0.000 | 0.000 |
0.897 0.891 | 0.902 |
0.103 0.097 | 0.108 |
|||
| Plot | Lyso | Other | |||||||||||
| Expt C |
8 peptides |
24 spectra |
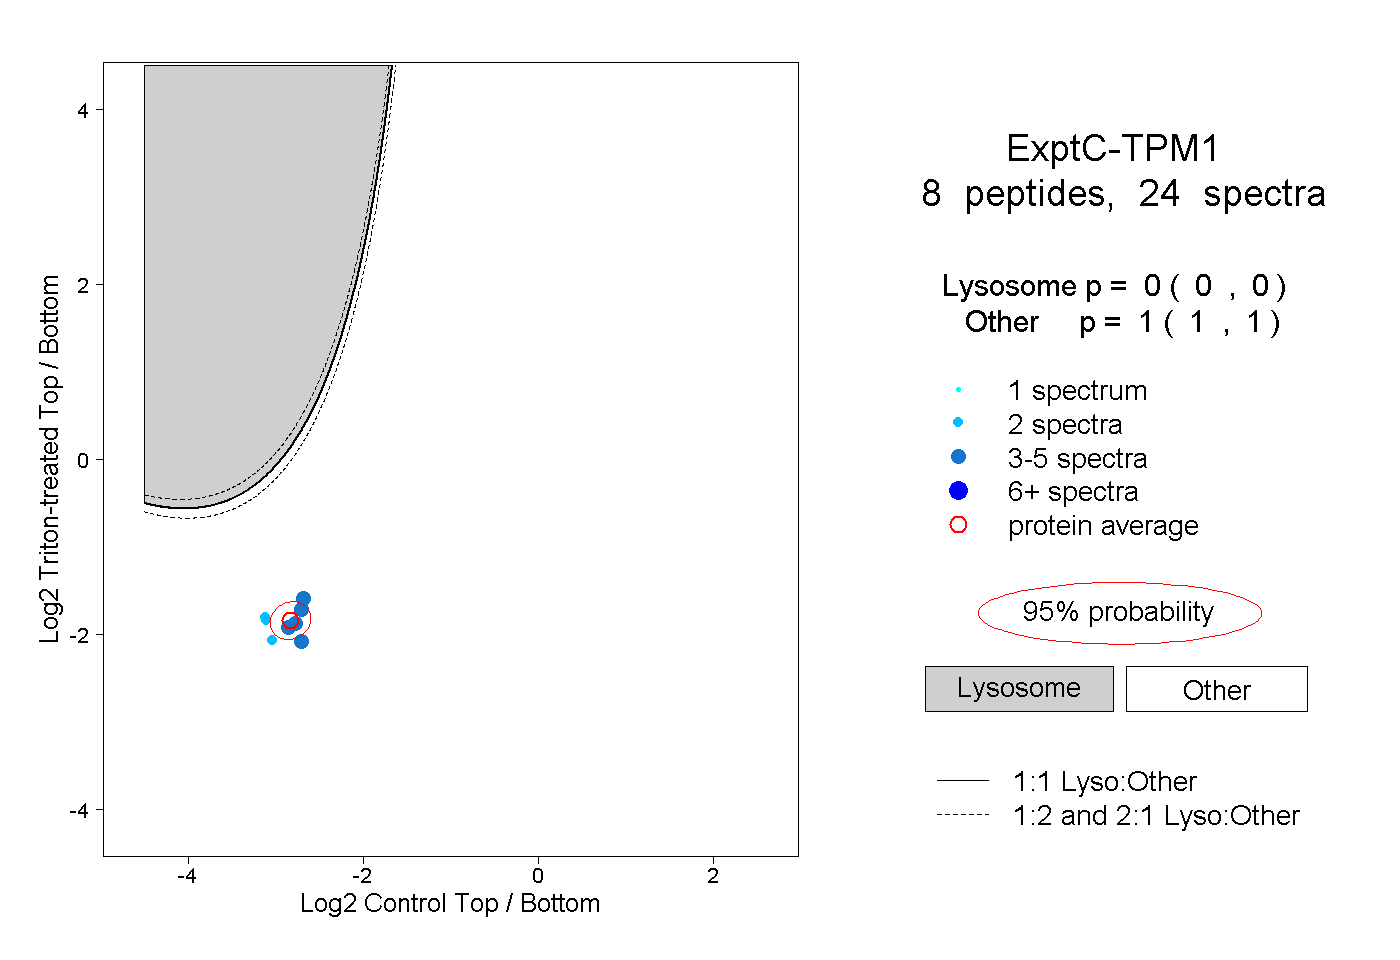 |
0.000 0.000 | 0.000 |
1.000 1.000 | 1.000 |
||||||||
| Plot | Lyso | Other | |||||||||||
| Expt D |
8 peptides |
20 spectra |
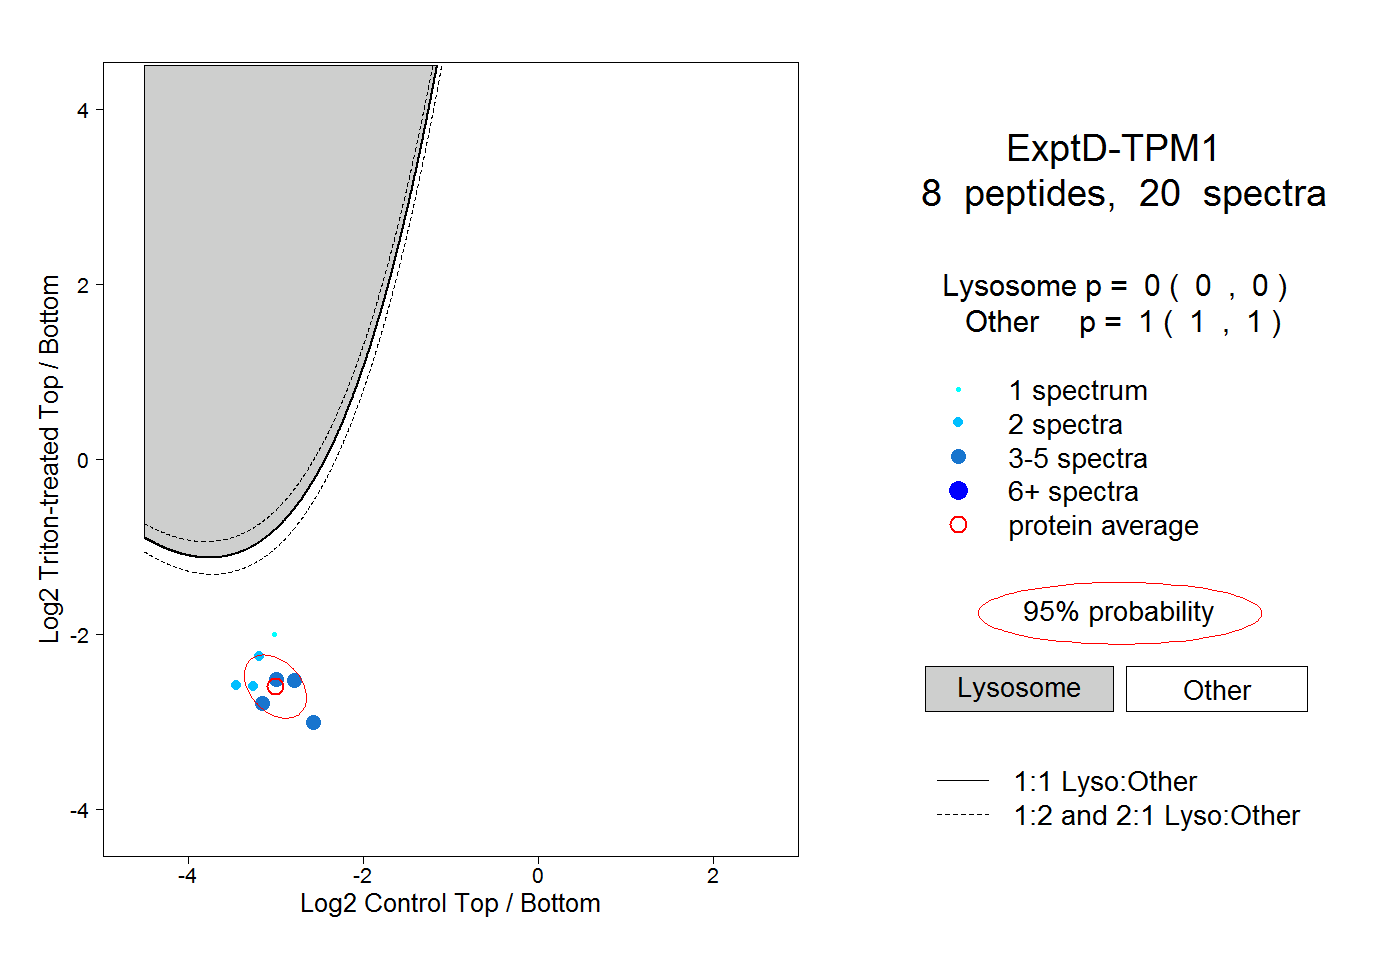 |
0.000 0.000 | 0.000 |
1.000 1.000 | 1.000 |