3
3peptides
spectra
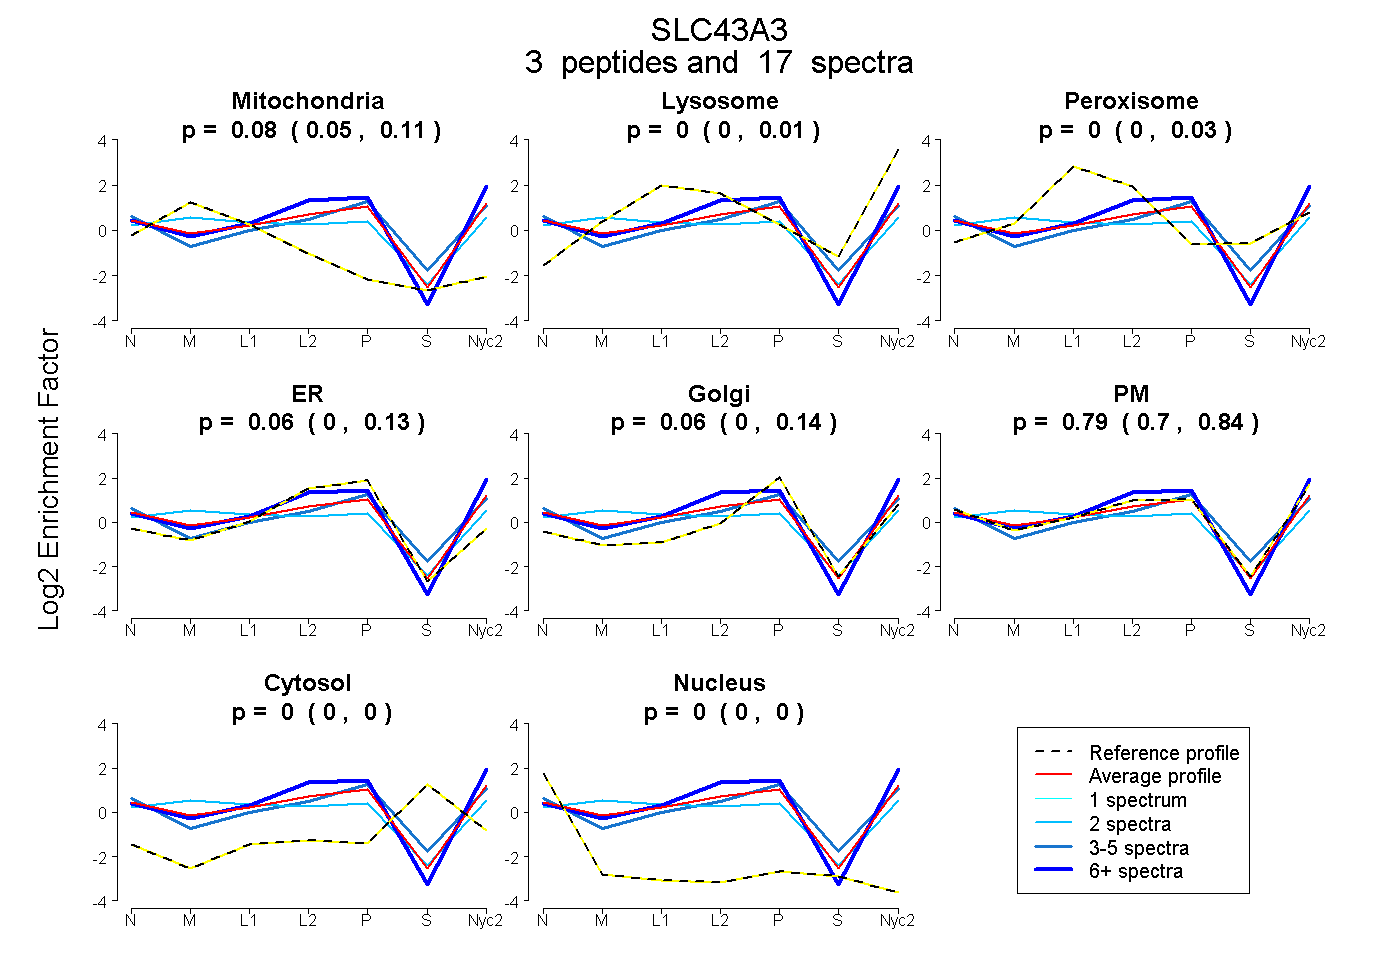
0.049 | 0.107
0.000 | 0.013
0.000 | 0.032
0.000 | 0.129
0.000 | 0.137
0.698 | 0.839
0.000 | 0.000
0.000 | 0.000
5peptides
spectra
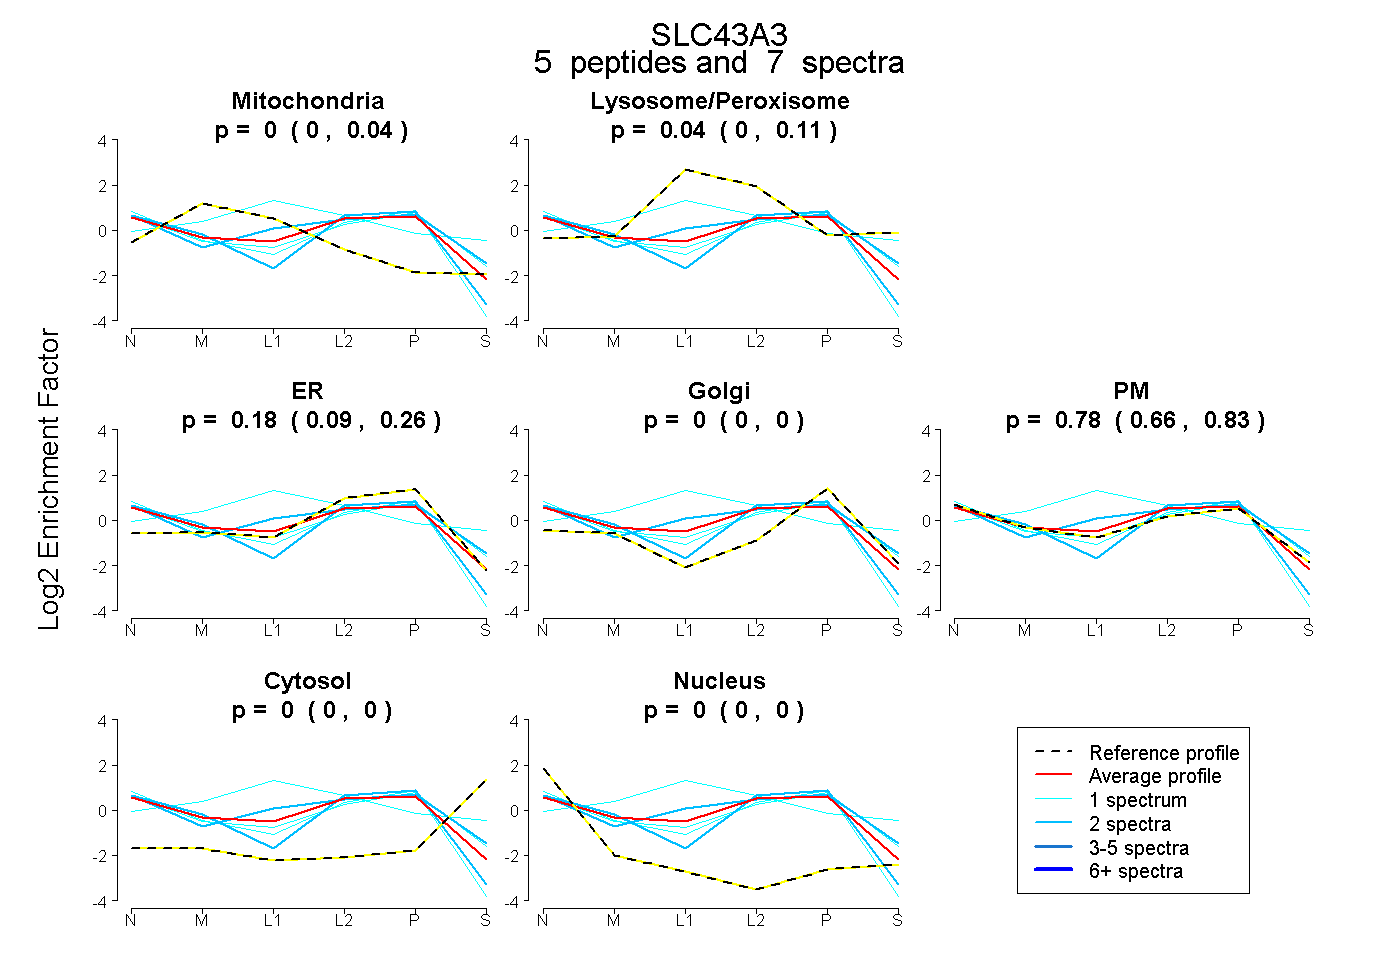
0.000 | 0.044
0.000 | 0.107
0.085 | 0.262
0.000 | 0.000
0.662 | 0.830
0.000 | 0.000
0.000 | 0.002