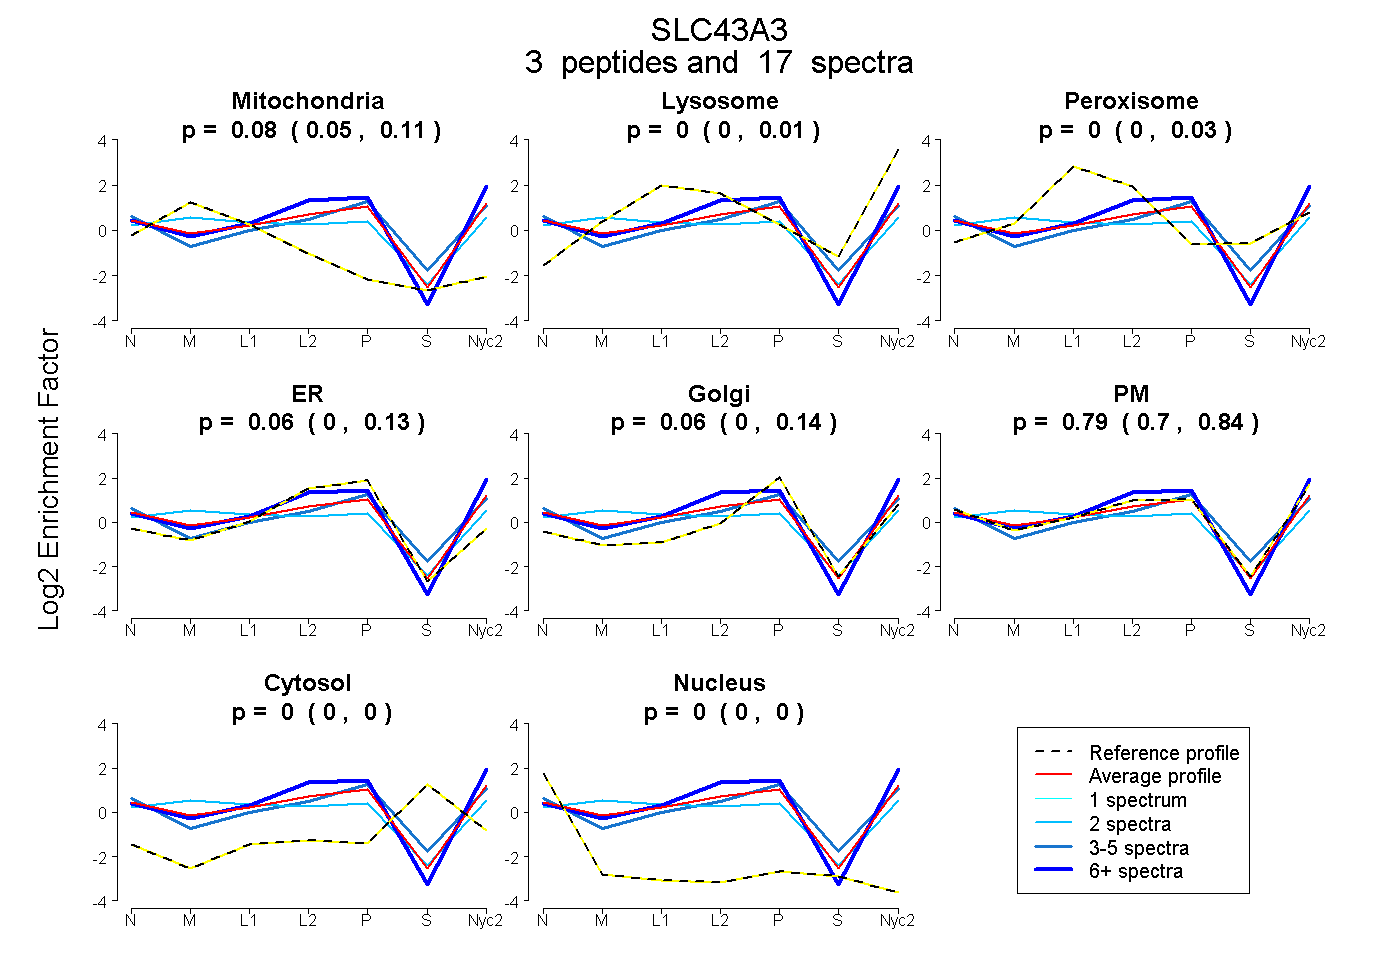
 3
3peptides
spectra
0.049 | 0.107
0.000 | 0.013
0.000 | 0.032
0.000 | 0.129
0.000 | 0.137
0.698 | 0.839
0.000 | 0.000
0.000 | 0.000
| Plot | Mito | Lyso | Perox | ER | Golgi | PM | Cytosol | Nucleus | |||||
| Expt A |
3 peptides |
17 spectra |
|
0.082 0.049 | 0.107 |
0.000 0.000 | 0.013 |
0.000 0.000 | 0.032 |
0.064 0.000 | 0.129 |
0.065 0.000 | 0.137 |
0.790 0.698 | 0.839 |
0.000 0.000 | 0.000 |
0.000 0.000 | 0.000 |
| 2 spectra, GHIPYPLPPNYSYGLCSR | 0.305 | 0.053 | 0.000 | 0.017 | 0.039 | 0.586 | 0.000 | 0.000 | ||
| 5 spectra, ECQSPK | 0.000 | 0.000 | 0.000 | 0.043 | 0.141 | 0.710 | 0.101 | 0.005 | ||
| 10 spectra, TFLLMPR | 0.000 | 0.000 | 0.000 | 0.056 | 0.000 | 0.944 | 0.000 | 0.000 |
| Plot | Mito | Lyso or Perox | ER | Golgi | PM | Cytosol | Nucleus | ||||||
| Expt B |
5 peptides |
7 spectra |
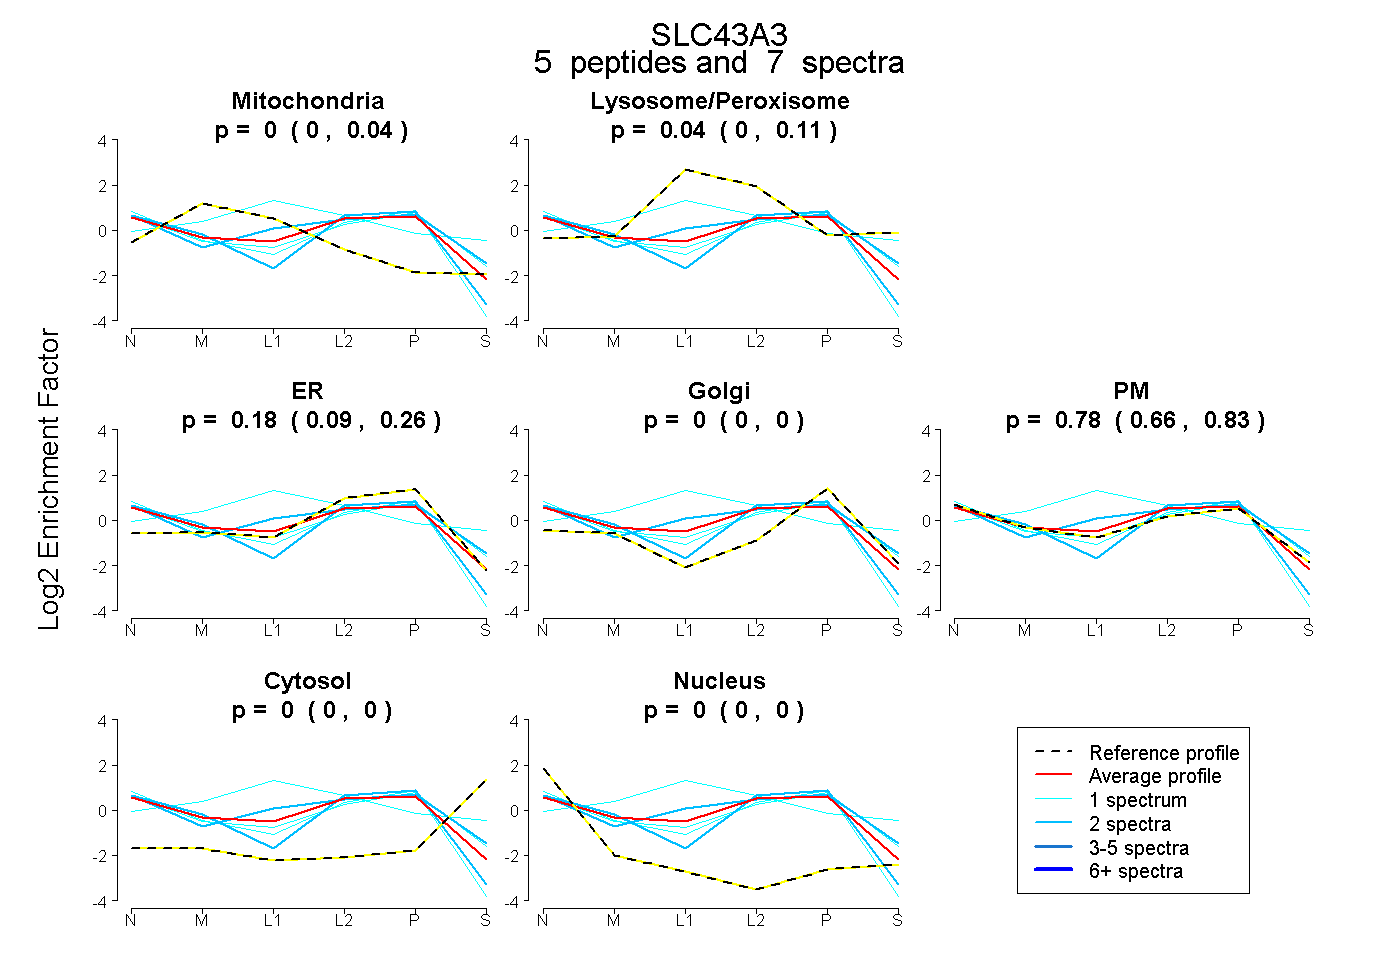 |
0.003 0.000 | 0.044 |
0.042 0.000 | 0.107 |
0.176 0.085 | 0.262 |
0.000 0.000 | 0.000 |
0.779 0.662 | 0.830 |
0.000 0.000 | 0.000 |
0.000 0.000 | 0.002 |
|||
| Plot | Lyso | Other | |||||||||||
| Expt C |
5 peptides |
26 spectra |
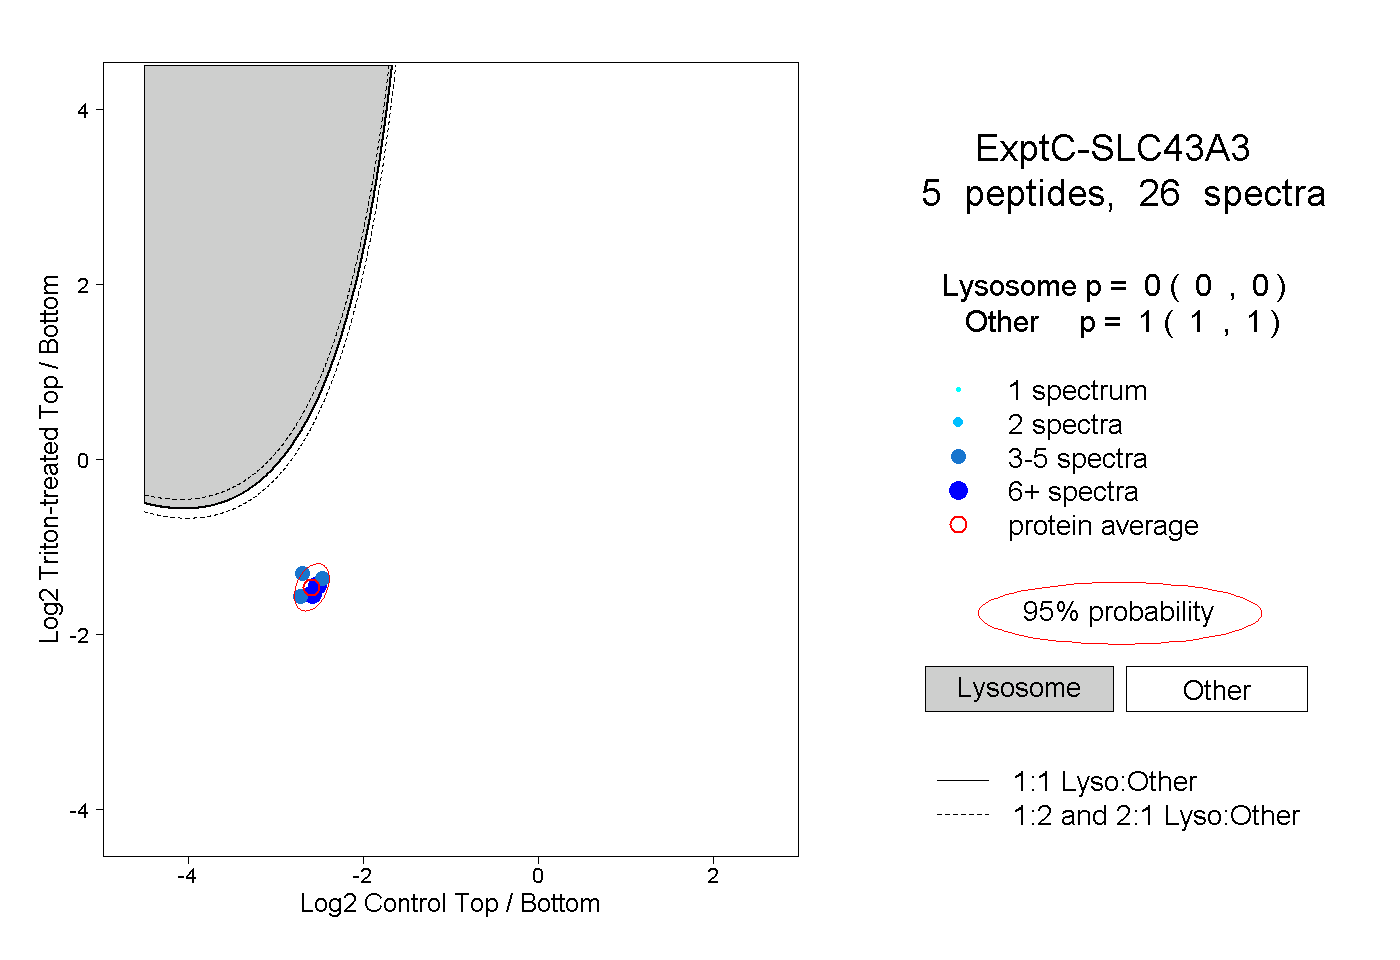 |
0.000 0.000 | 0.000 |
1.000 1.000 | 1.000 |
||||||||
| Plot | Lyso | Other | |||||||||||
| Expt D |
5 peptides |
7 spectra |
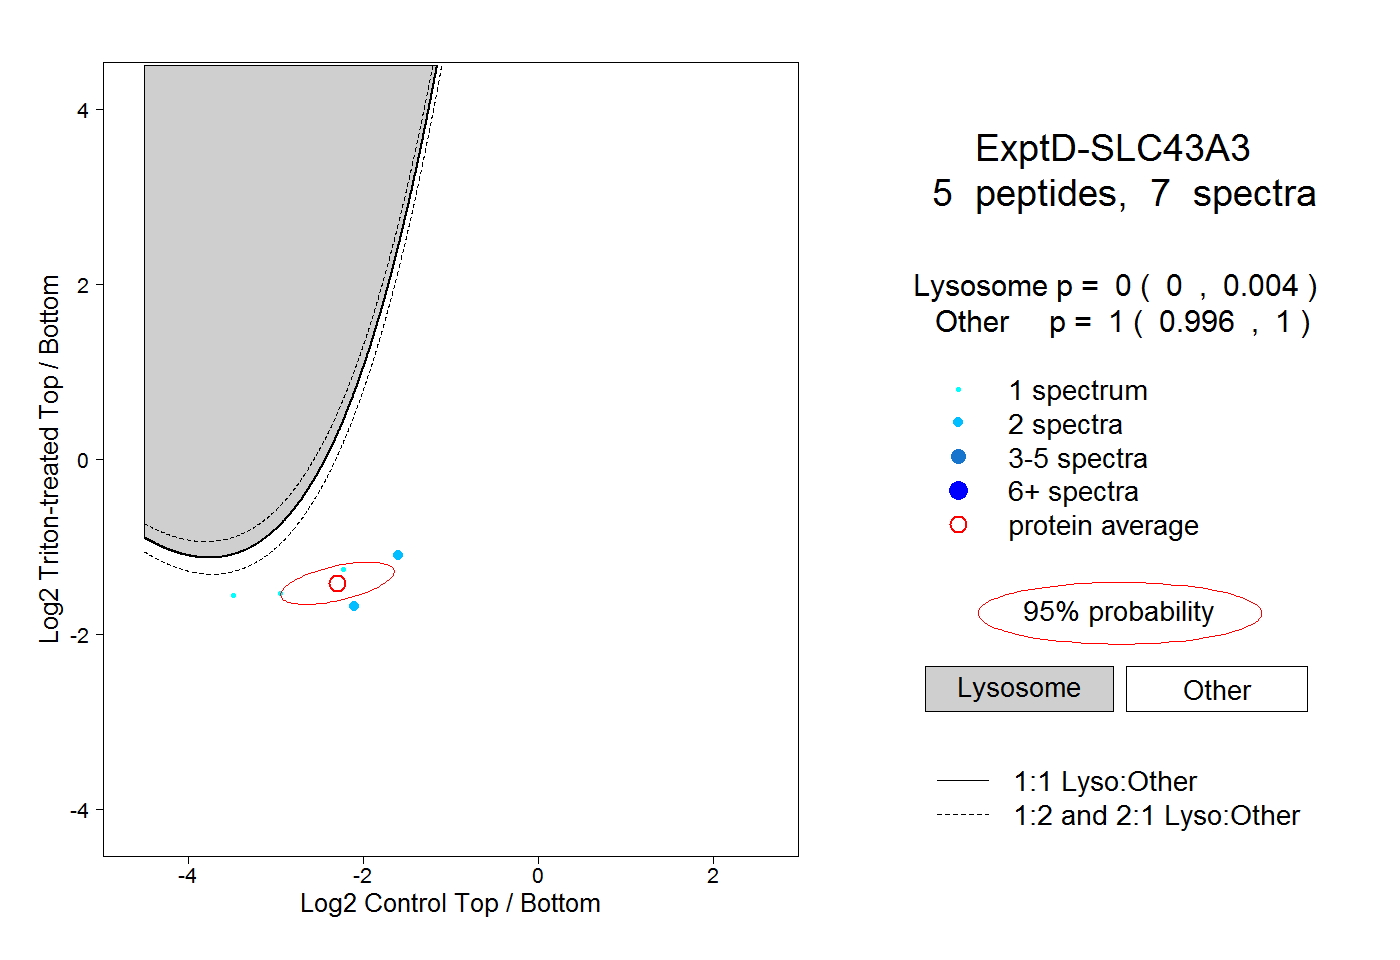 |
0.000 0.000 | 0.004 |
1.000 0.996 | 1.000 |