 2
2peptides
spectra
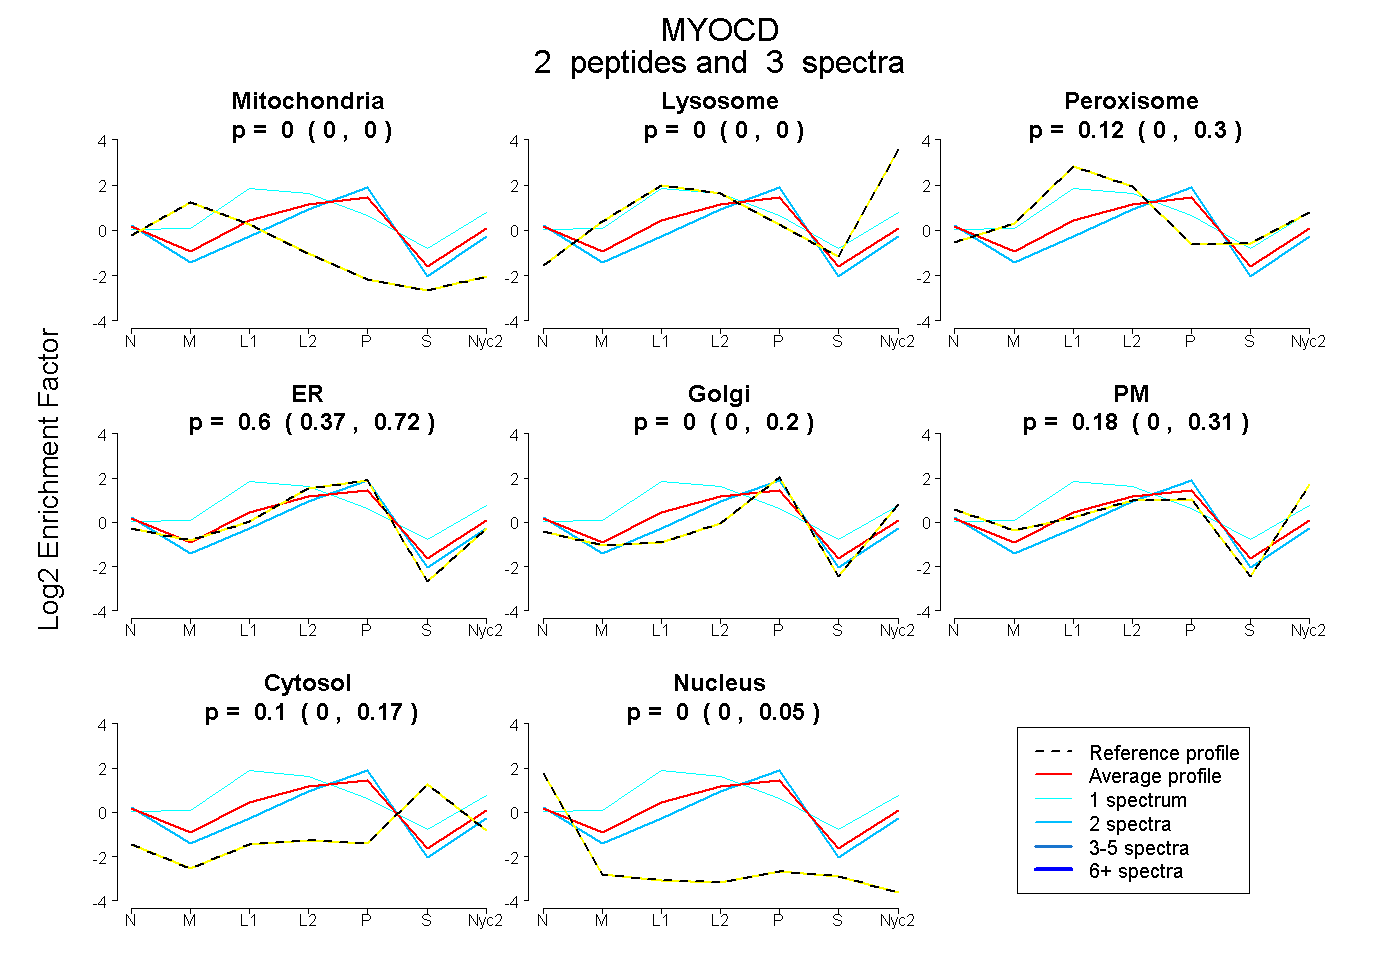
0.000 | 0.000
0.000 | 0.000
0.000 | 0.300
0.374 | 0.725
0.000 | 0.203
0.000 | 0.308
0.000 | 0.171
0.000 | 0.045
| Plot | Mito | Lyso | Perox | ER | Golgi | PM | Cytosol | Nucleus | |||||
| Expt A |
2 peptides |
3 spectra |
|
0.000 0.000 | 0.000 |
0.000 0.000 | 0.000 |
0.121 0.000 | 0.300 |
0.601 0.374 | 0.725 |
0.000 0.000 | 0.203 |
0.178 0.000 | 0.308 |
0.100 0.000 | 0.171 |
0.000 0.000 | 0.045 |
| 2 spectra, SVLQLR | 0.000 | 0.000 | 0.000 | 0.717 | 0.175 | 0.000 | 0.071 | 0.037 | ||
| 1 spectrum, DGLSPDQAR | 0.000 | 0.000 | 0.642 | 0.133 | 0.055 | 0.169 | 0.000 | 0.000 |
| Plot | Lyso | Other | |||||||||||
| Expt C |
1 peptide |
1 spectrum |
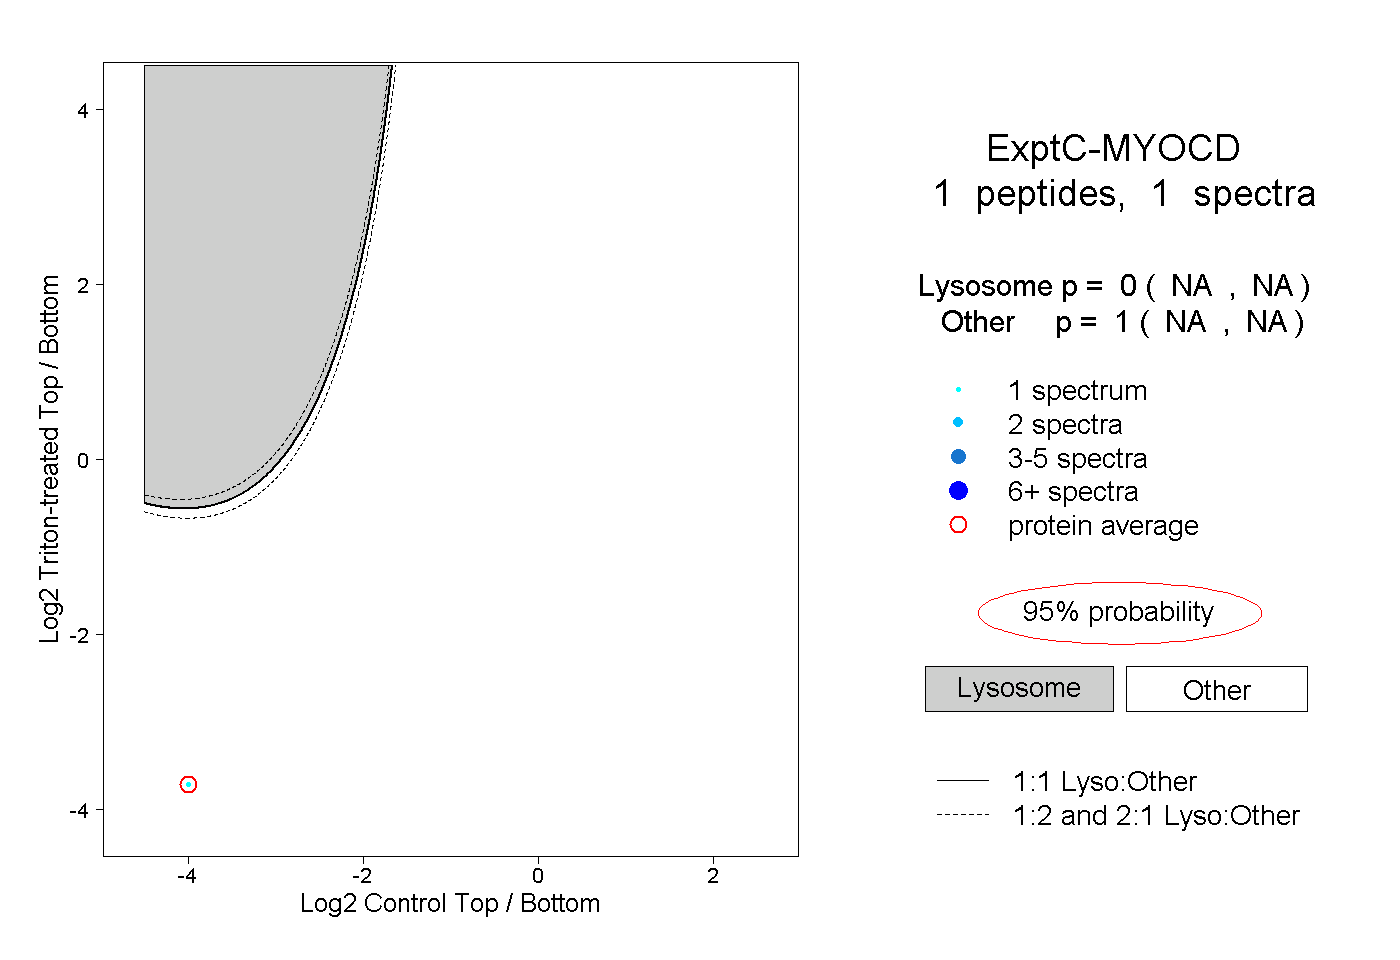 |
0.000 NA | NA |
1.000 NA | NA |