 5
5peptides
spectra
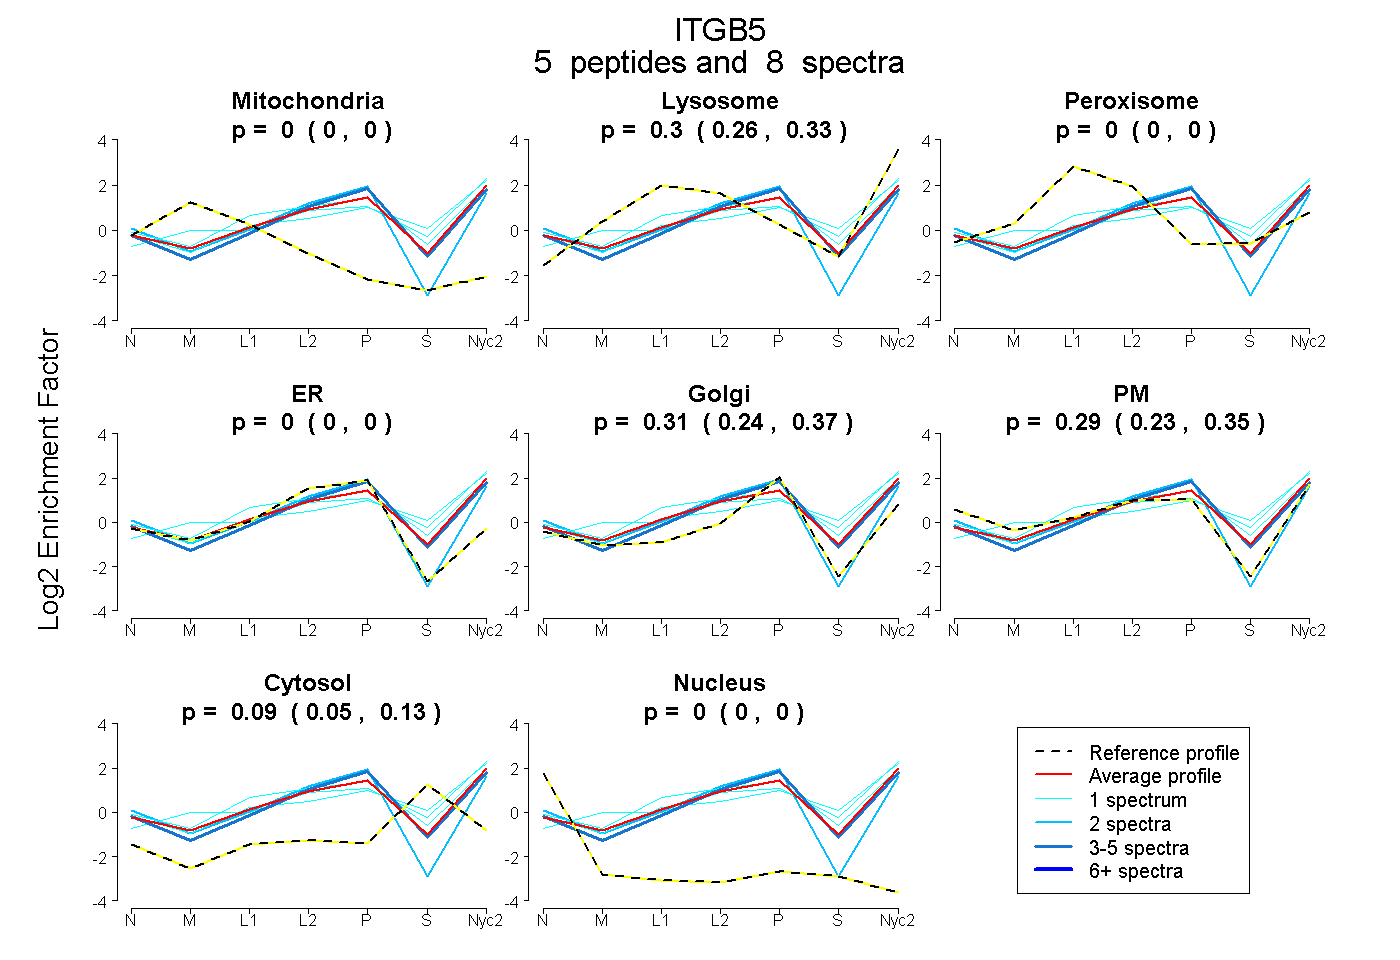
0.000 | 0.000
0.264 | 0.334
0.000 | 0.000
0.000 | 0.003
0.242 | 0.374
0.225 | 0.355
0.051 | 0.130
0.000 | 0.000
3peptides
spectra
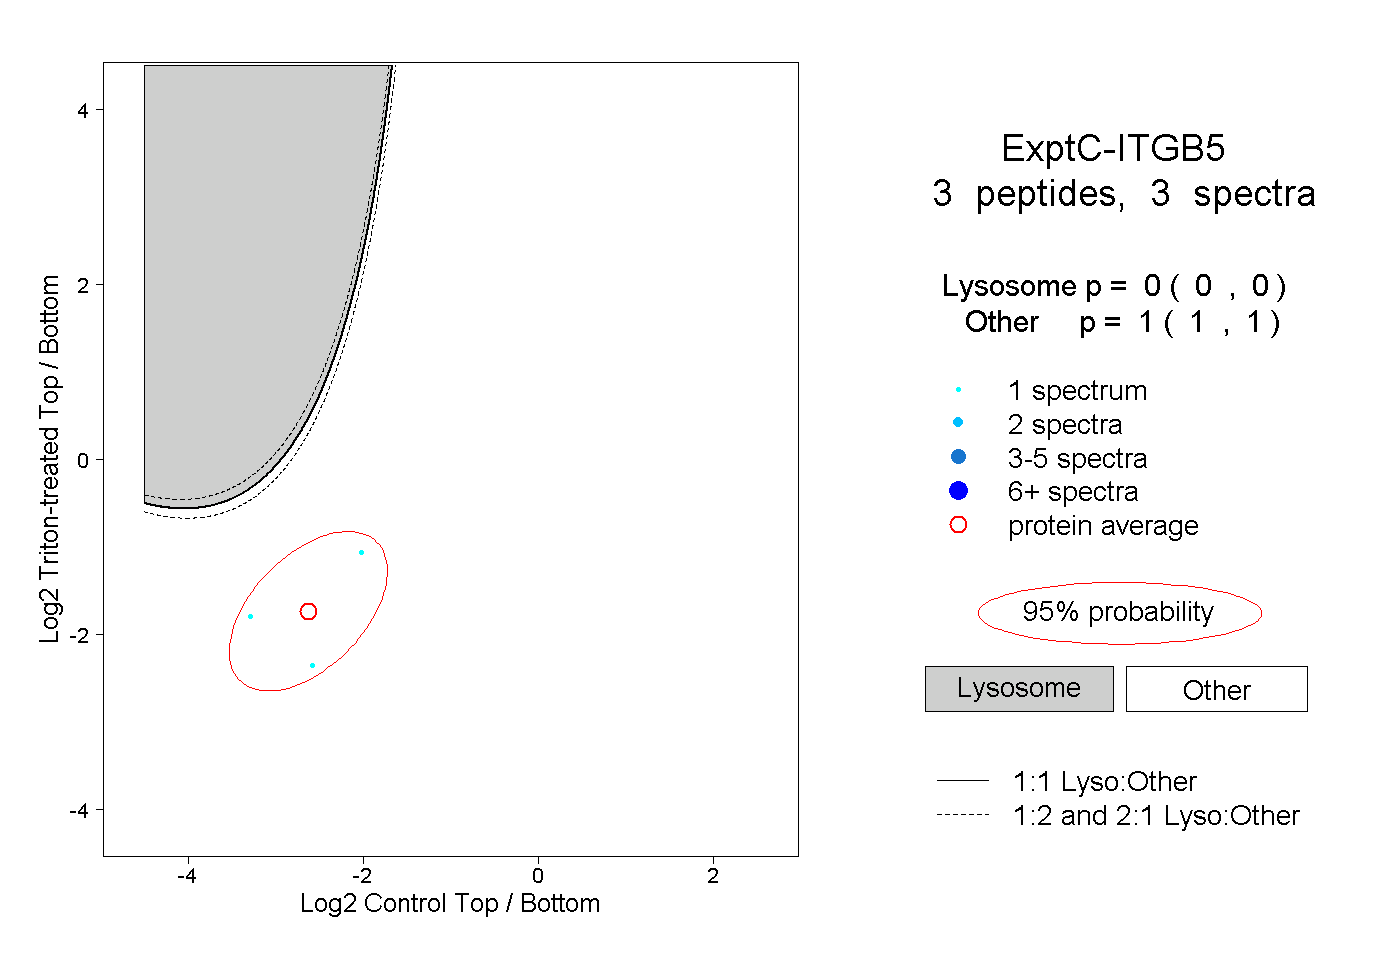
0.000 | 0.000
1.000 | 1.000
| Plot | Mito | Lyso | Perox | ER | Golgi | PM | Cytosol | Nucleus | |||||
| Expt A |
5 peptides |
8 spectra |
|
0.000 0.000 | 0.000 |
0.301 0.264 | 0.334 |
0.000 0.000 | 0.000 |
0.000 0.000 | 0.003 |
0.312 0.242 | 0.374 |
0.294 0.225 | 0.355 |
0.094 0.051 | 0.130 |
0.000 0.000 | 0.000 |
||
| Plot | Lyso | Other | |||||||||||
| Expt C |
3 peptides |
3 spectra |
|
0.000 0.000 | 0.000 |
1.000 1.000 | 1.000 |