 28
28peptides
spectra
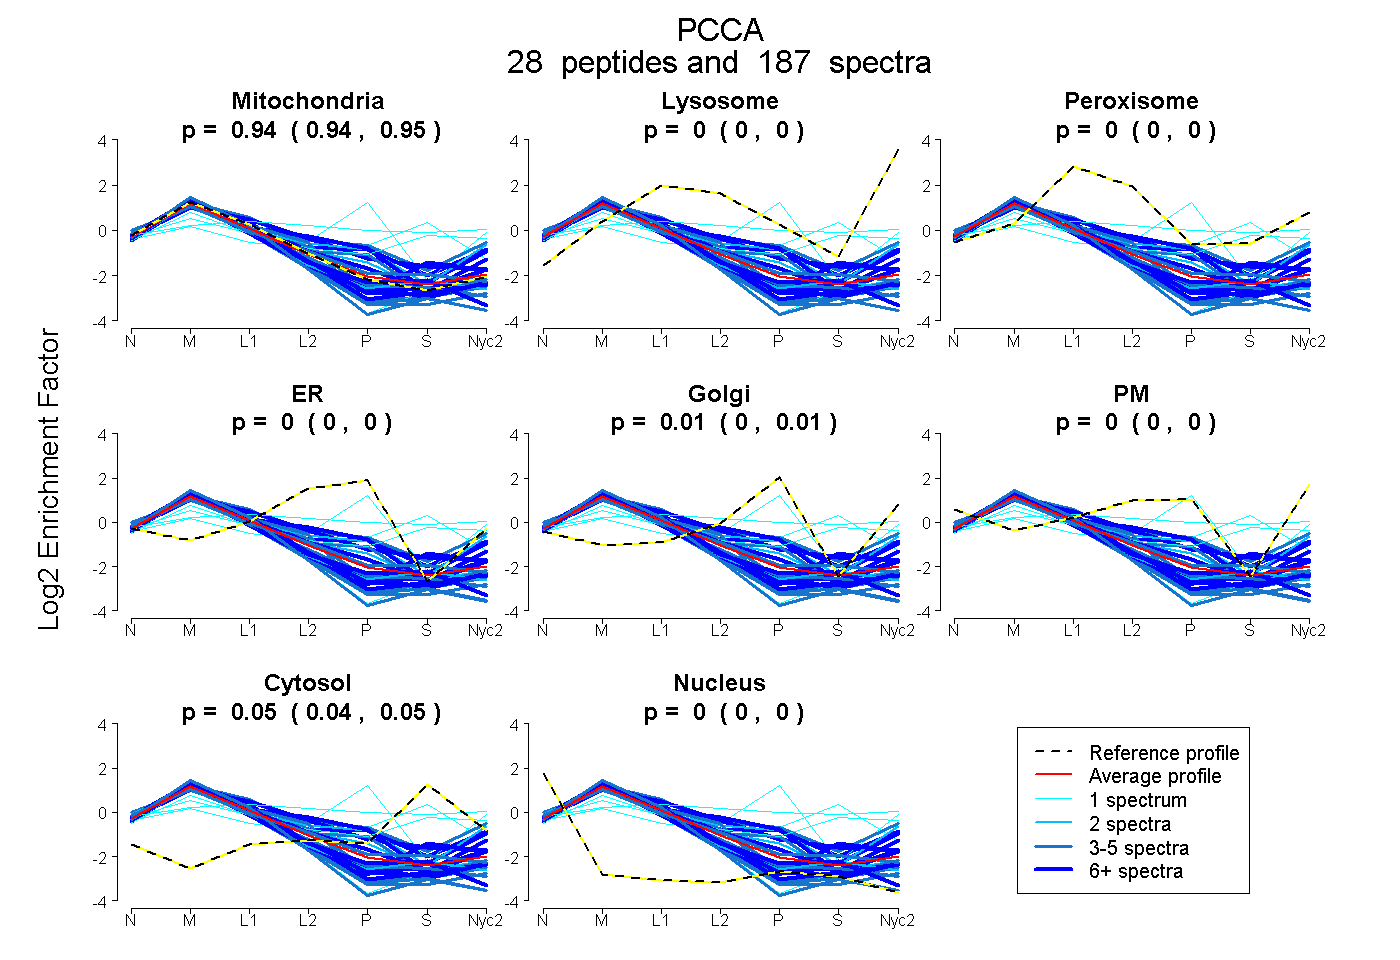
0.941 | 0.947
0.000 | 0.000
0.000 | 0.000
0.000 | 0.000
0.005 | 0.014
0.000 | 0.000
0.043 | 0.049
0.000 | 0.000
24peptides
spectra
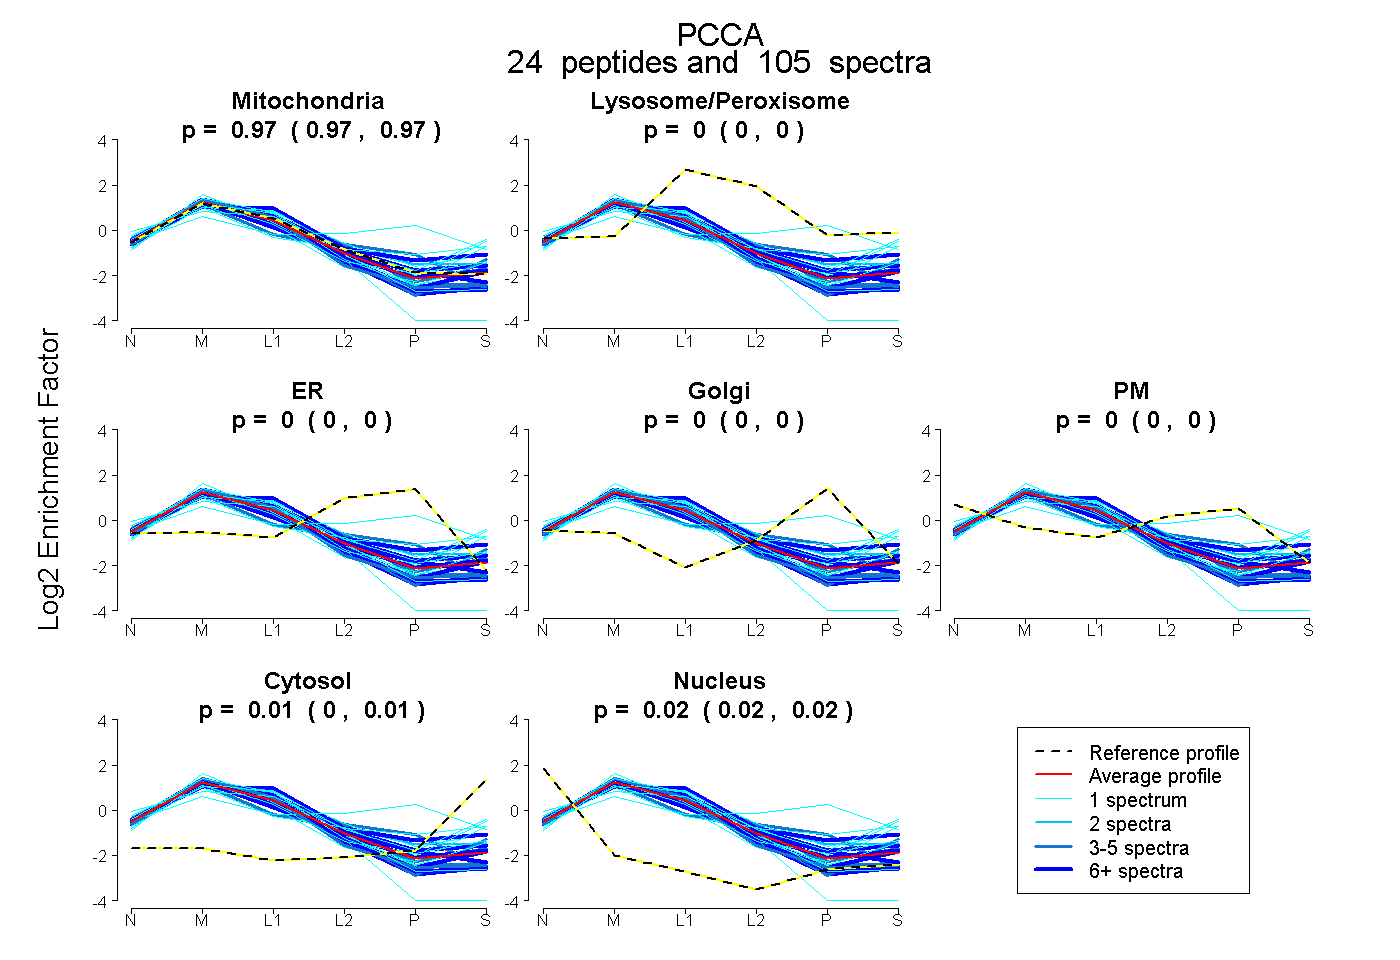
0.968 | 0.973
0.000 | 0.000
0.000 | 0.000
0.000 | 0.000
0.000 | 0.000
0.005 | 0.014
0.016 | 0.022
34peptides
spectra
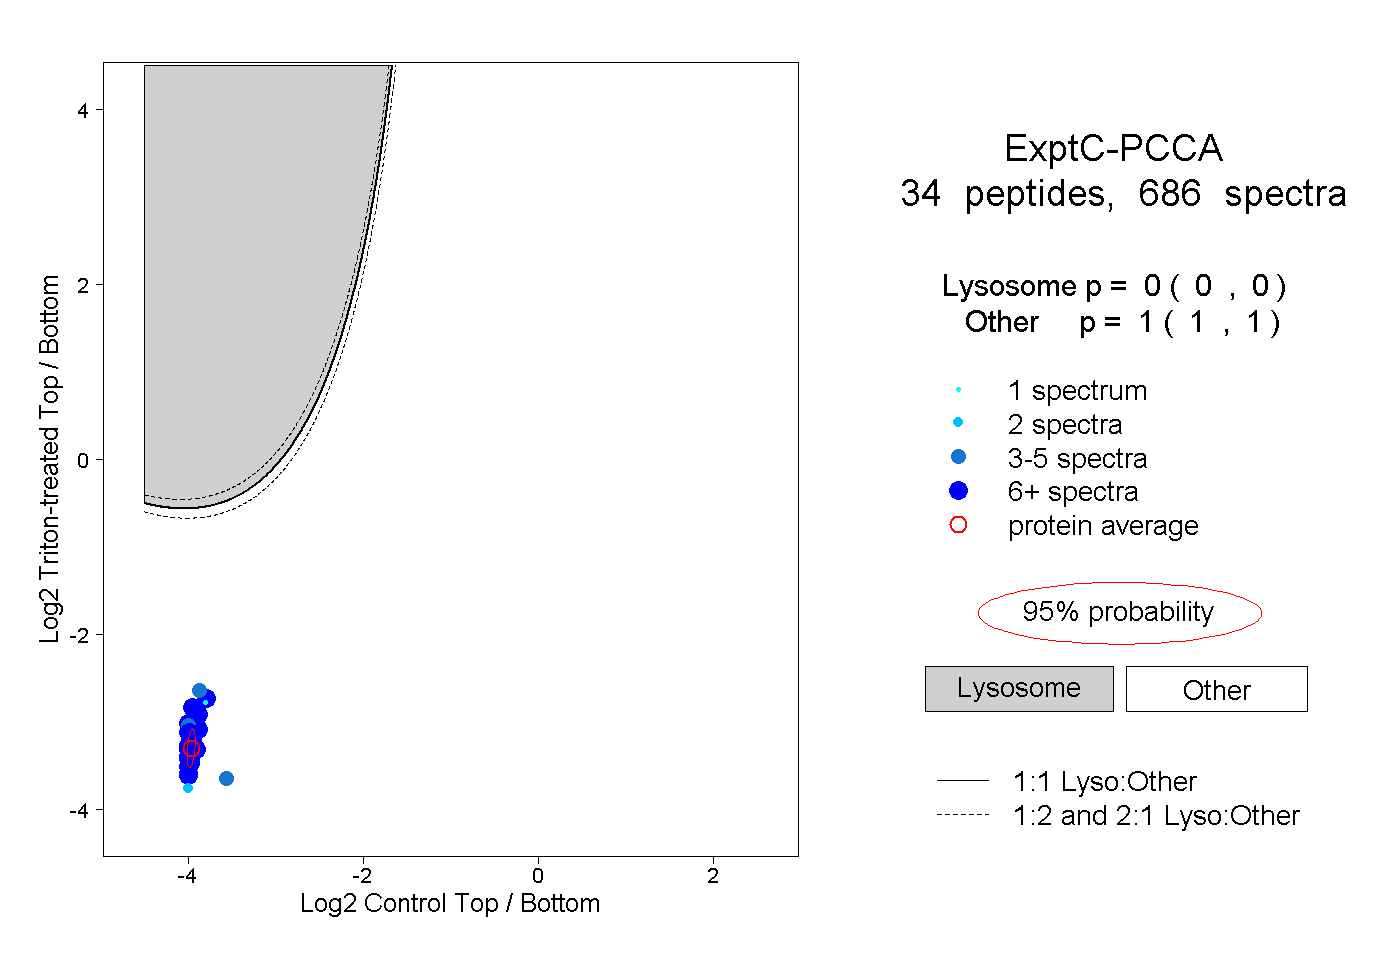
0.000 | 0.000
1.000 | 1.000
16peptides
spectra
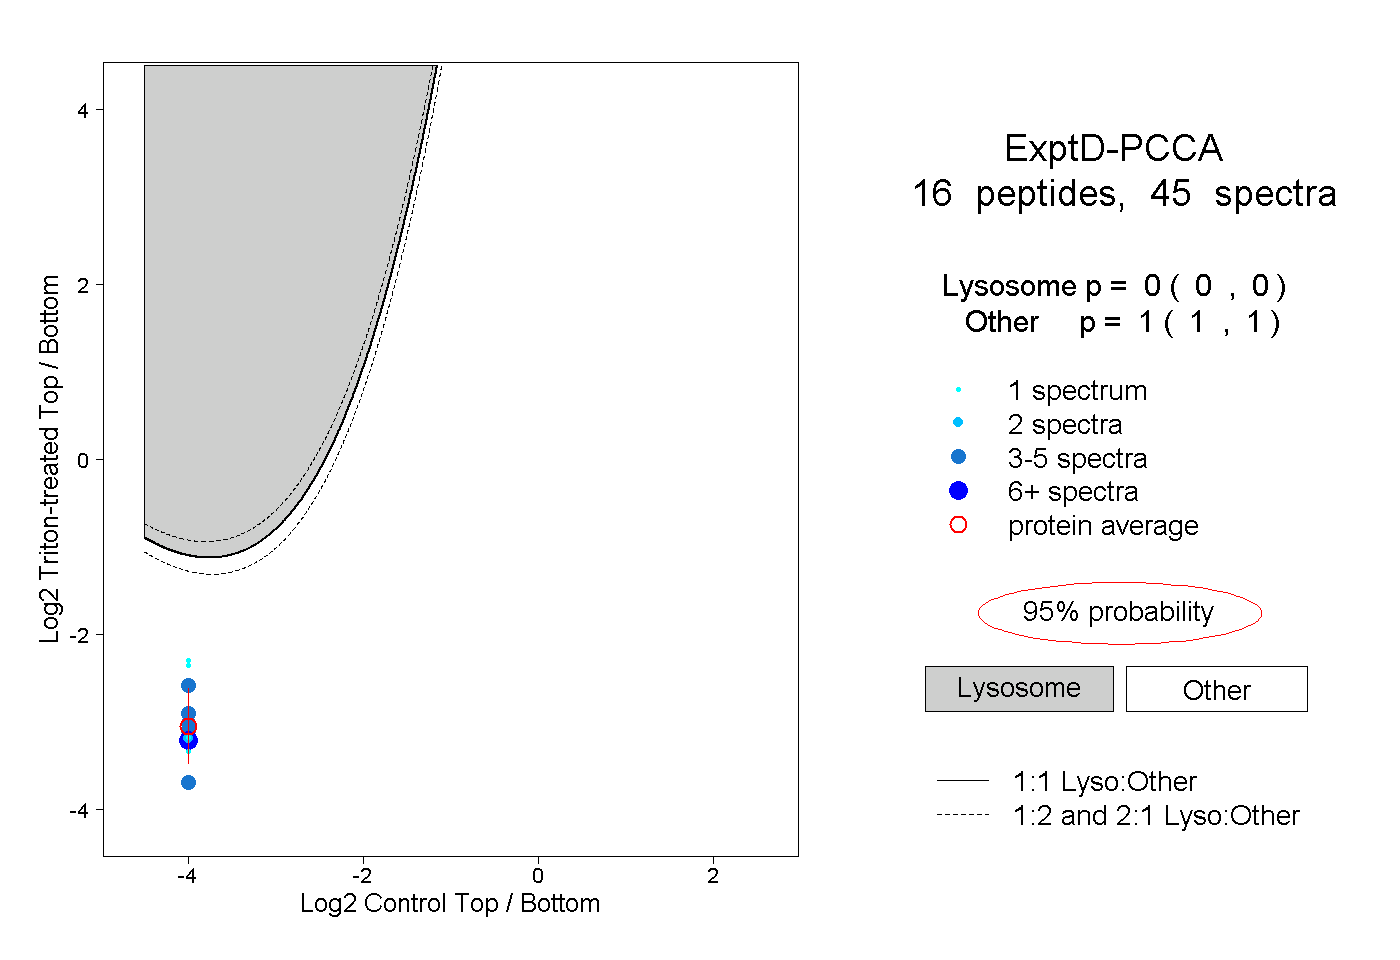
0.000 | 0.000
1.000 | 1.000