| 12 spectra, GVTHNIPLLR |
0.915 |
|
0.047 |
|
0.000 |
0.000 |
0.000 |
0.038 |
0.000 |
|
| 4 spectra, FSSQEAASSFGDDR |
0.887 |
|
0.000 |
|
0.000 |
0.000 |
0.000 |
0.053 |
0.059 |
|
| 3 spectra, FIDNPR |
0.834 |
|
0.000 |
|
0.166 |
0.000 |
0.000 |
0.000 |
0.000 |
|
| 1 spectrum, MADEAVCVGPAPTSK |
0.713 |
|
0.042 |
|
0.000 |
0.000 |
0.000 |
0.245 |
0.000 |
|
| 6 spectra, LSQYQEPIHLPGVR |
0.941 |
|
0.000 |
|
0.000 |
0.000 |
0.000 |
0.026 |
0.034 |
|
| 1 spectrum, MEDALDSYVIR |
0.936 |
|
0.000 |
|
0.000 |
0.000 |
0.000 |
0.000 |
0.064 |
|
| 2 spectra, EIGYPVMIK |
0.844 |
|
0.042 |
|
0.000 |
0.053 |
0.000 |
0.061 |
0.000 |
|
| 1 spectrum, YSSAGTVEFLVDSQK |
0.603 |
|
0.178 |
|
0.000 |
0.000 |
0.097 |
0.118 |
0.005 |
|
| 30 spectra, ILLANR |
0.973 |
|
0.000 |
|
0.000 |
0.000 |
0.000 |
0.000 |
0.027 |
|
| 9 spectra, TVQCLSR |
0.956 |
|
0.000 |
|
0.000 |
0.000 |
0.000 |
0.000 |
0.044 |
|
| 1 spectrum, HIEIQVLGDK |
0.783 |
|
0.000 |
|
0.000 |
0.000 |
0.000 |
0.210 |
0.007 |
|
| 1 spectrum, FQEHSR |
0.776 |
|
0.168 |
|
0.000 |
0.000 |
0.000 |
0.056 |
0.000 |
|
| 3 spectra, VPVIRPDVAK |
0.947 |
|
0.000 |
|
0.000 |
0.000 |
0.000 |
0.000 |
0.053 |
|
| 6 spectra, EVIINTR |
0.950 |
|
0.000 |
|
0.000 |
0.000 |
0.000 |
0.000 |
0.050 |
|
| 1 spectrum, TVAIHSDVDASSVHVK |
0.658 |
|
0.179 |
|
0.000 |
0.000 |
0.000 |
0.162 |
0.000 |
|
| 3 spectra, FLSDVYPDGFK |
0.987 |
|
0.000 |
|
0.000 |
0.000 |
0.000 |
0.000 |
0.013 |
|
| 3 spectra, IAWDDEETR |
0.906 |
|
0.000 |
|
0.000 |
0.000 |
0.000 |
0.094 |
0.000 |
|
| 1 spectrum, WELSVK |
0.884 |
|
0.000 |
|
0.000 |
0.000 |
0.000 |
0.116 |
0.000 |
|
| 1 spectrum, VVEEAPSIFLDPETR |
0.948 |
|
0.000 |
|
0.000 |
0.000 |
0.000 |
0.026 |
0.026 |
|
| 7 spectra, HGNALWLNER |
0.758 |
|
0.176 |
|
0.000 |
0.000 |
0.000 |
0.066 |
0.000 |
|
| 1 spectrum, SYLNMDAIMEAIK |
0.267 |
|
0.278 |
|
0.000 |
0.420 |
0.000 |
0.036 |
0.000 |
|
| 6 spectra, SFGLPSIGR |
0.927 |
|
0.000 |
|
0.000 |
0.030 |
0.000 |
0.000 |
0.043 |
|
| 1 spectrum, VYAEDPYK |
0.991 |
|
0.000 |
|
0.000 |
0.000 |
0.000 |
0.000 |
0.009 |
|
| 1 spectrum, NFYFLEMNTR |
0.983 |
|
0.000 |
|
0.000 |
0.000 |
0.000 |
0.000 |
0.017 |
|
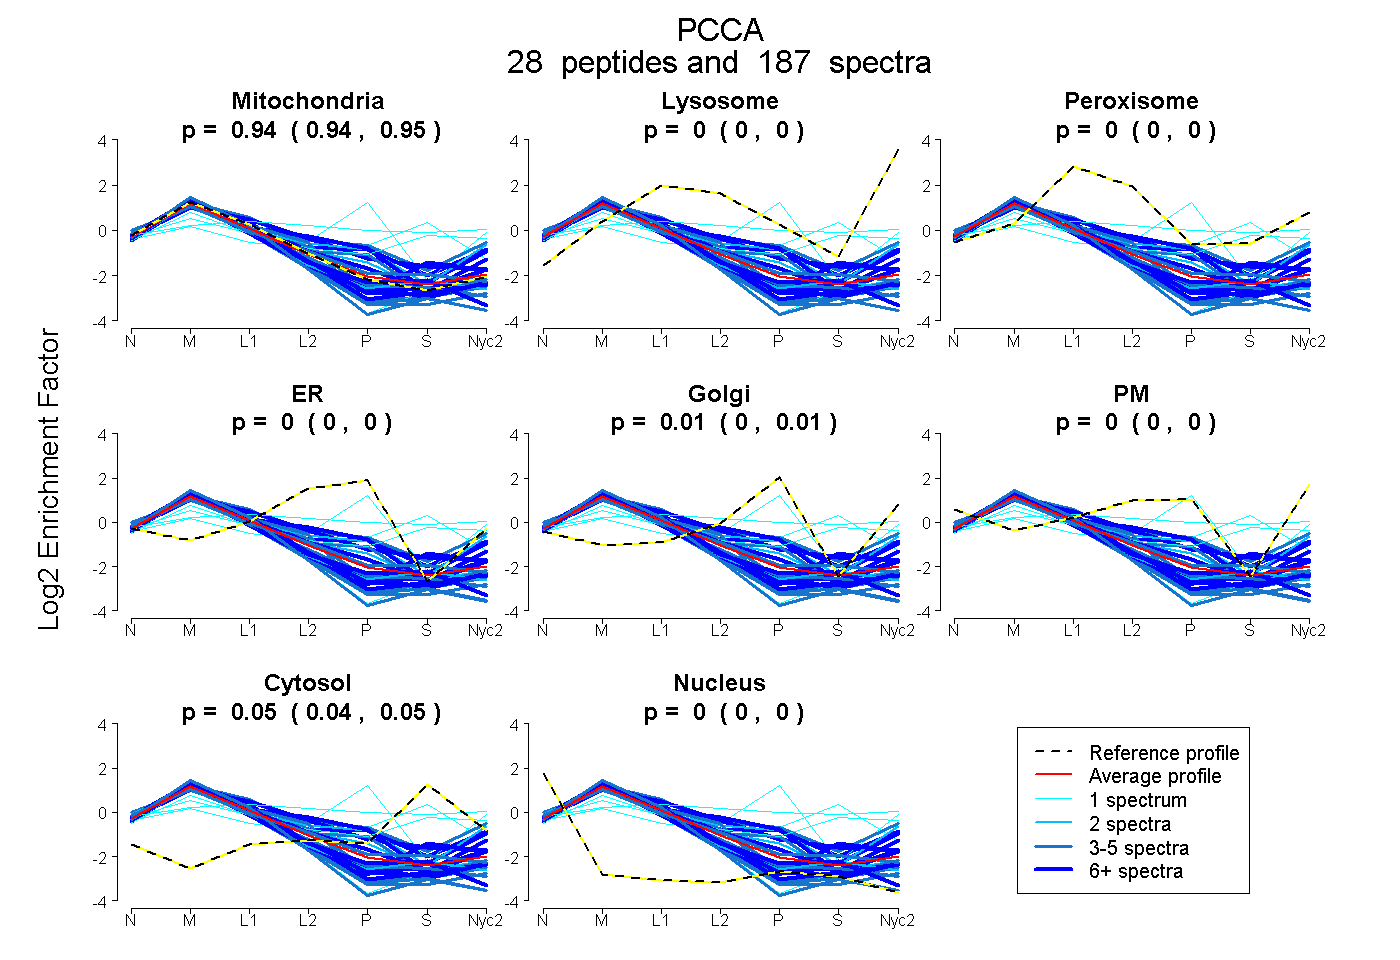
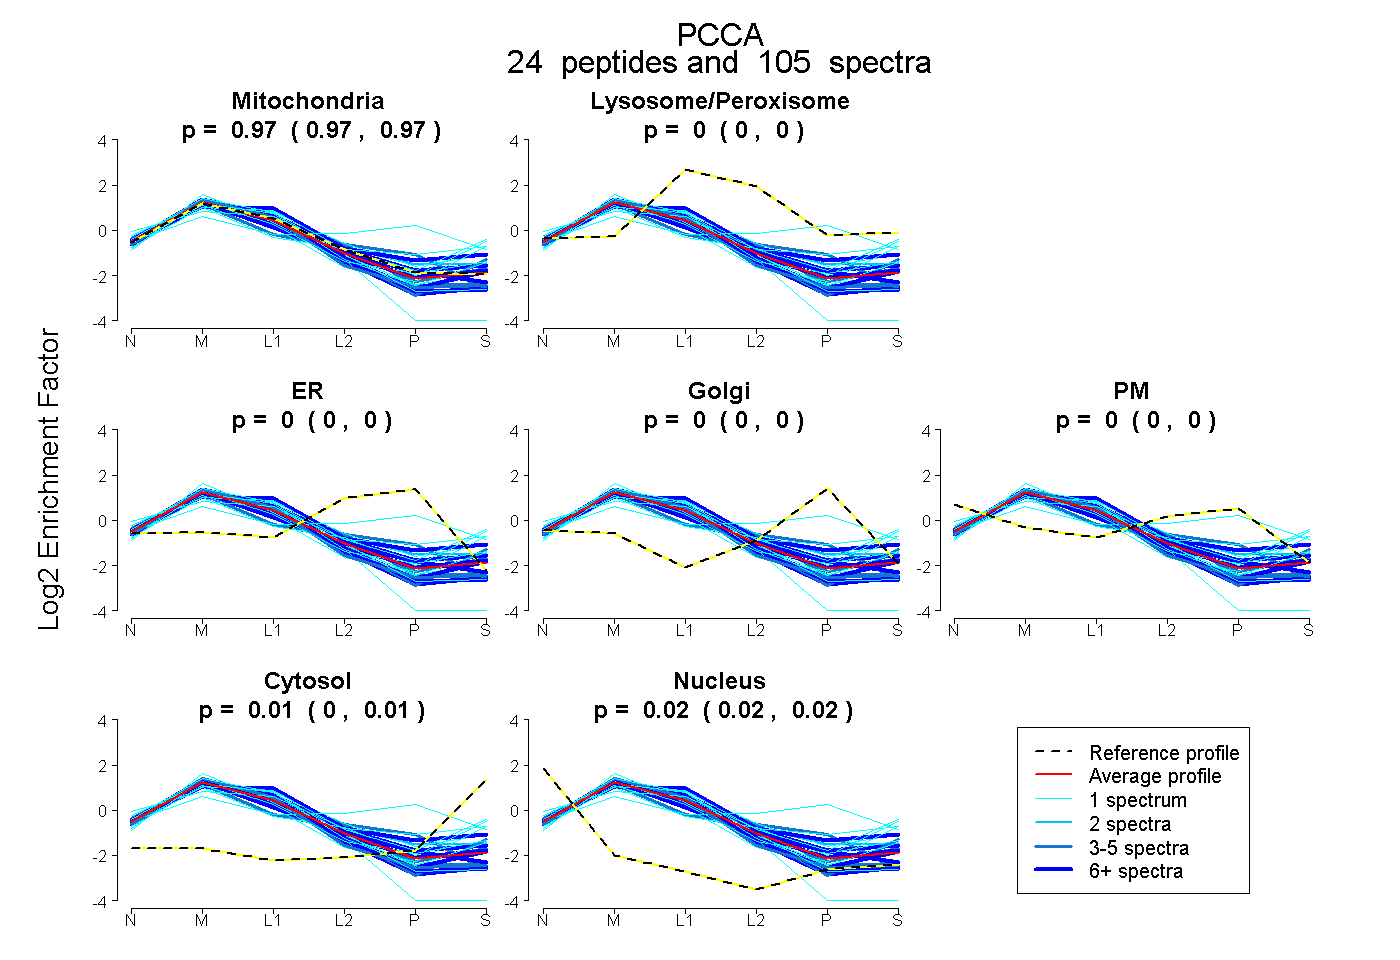
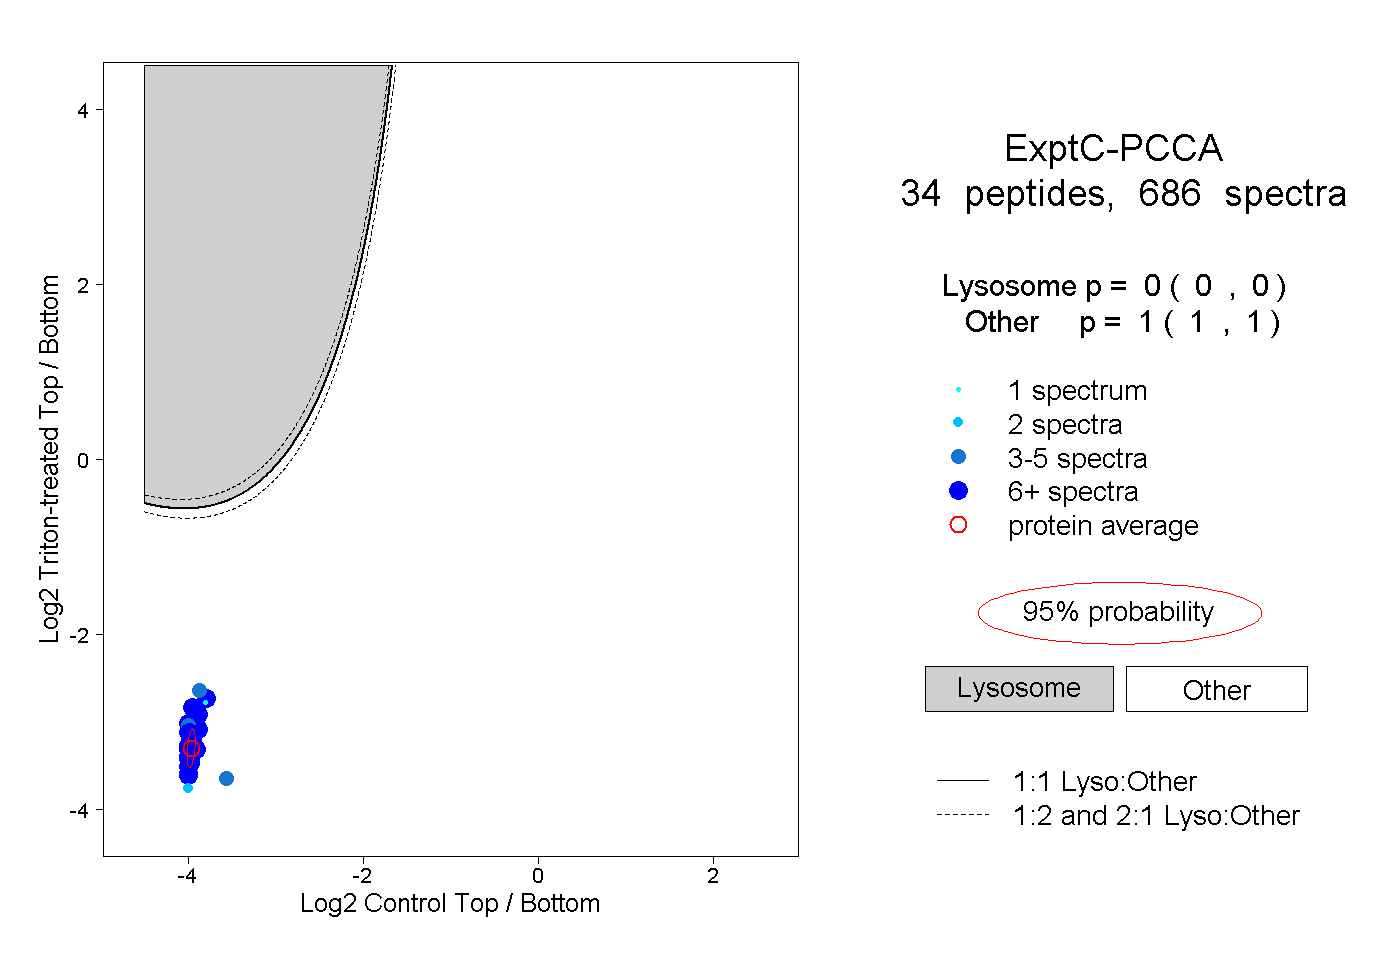
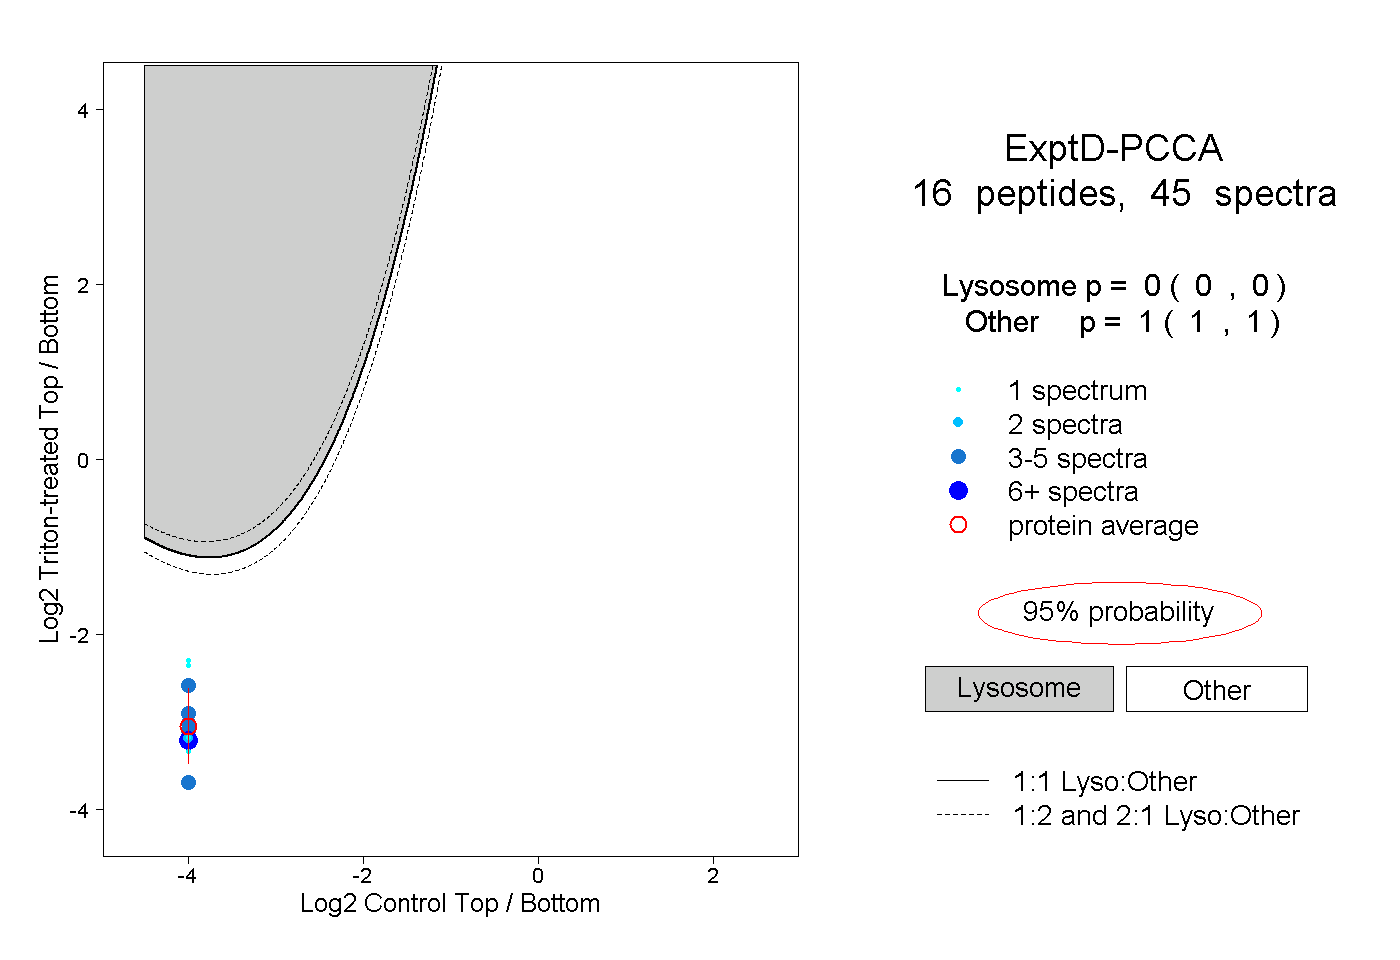
 28
28