 28
28peptides
spectra
0.941 | 0.947
0.000 | 0.000
0.000 | 0.000
0.000 | 0.000
0.005 | 0.014
0.000 | 0.000
0.043 | 0.049
0.000 | 0.000
| Plot | Mito | Lyso | Perox | ER | Golgi | PM | Cytosol | Nucleus | |||||
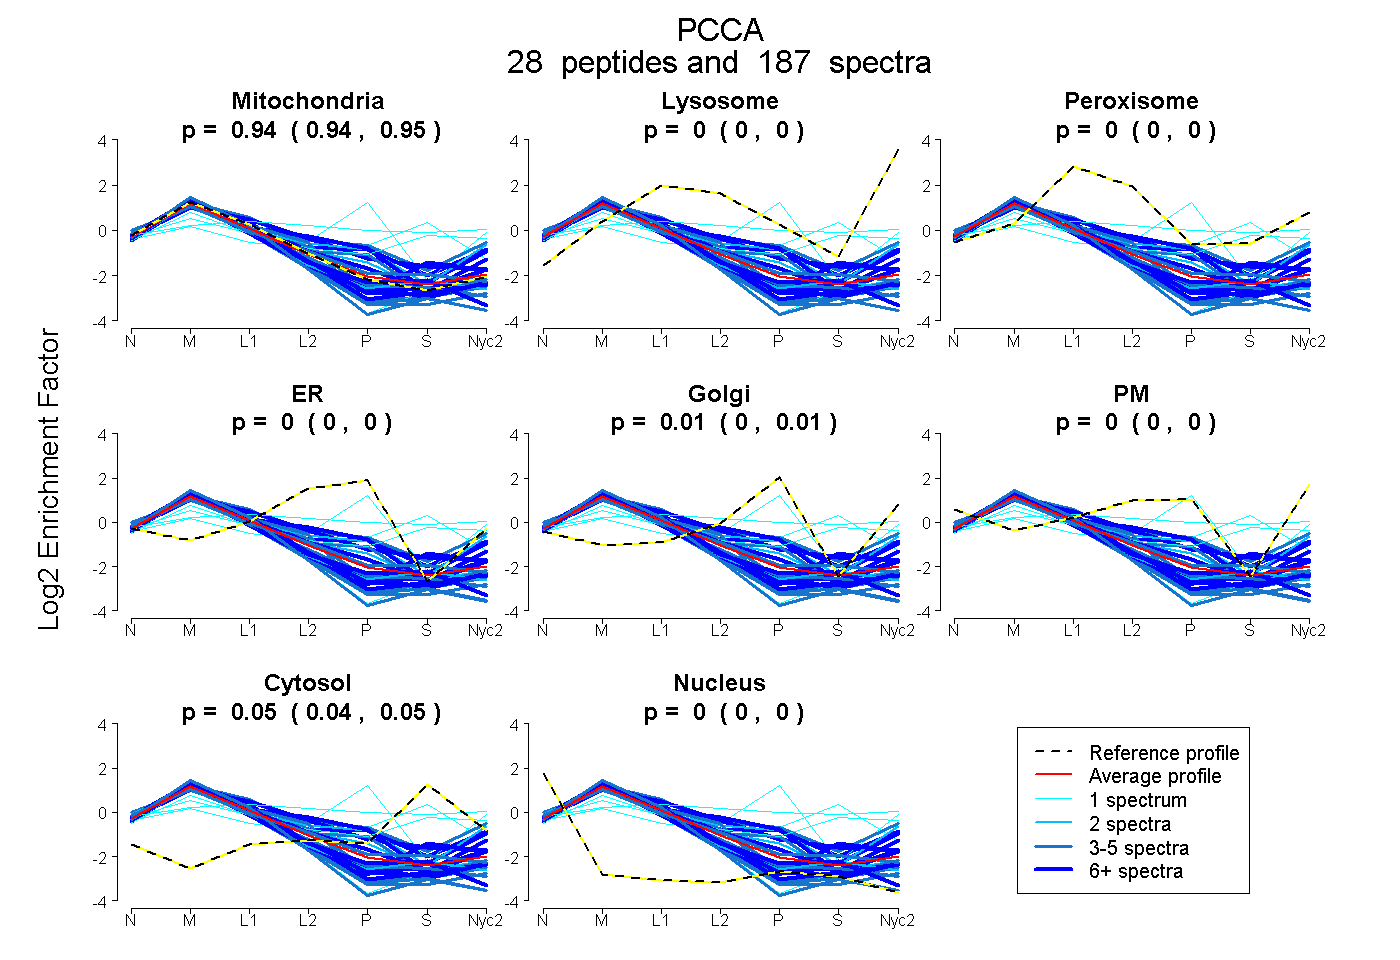
| Expt A |
28 peptides |
187 spectra |
|
0.944 0.941 | 0.947 |
0.000 0.000 | 0.000 |
0.000 0.000 | 0.000 |
0.000 0.000 | 0.000 |
0.010 0.005 | 0.014 |
0.000 0.000 | 0.000 |
0.046 0.043 | 0.049 |
0.000 0.000 | 0.000 |
| 15 spectra, GVTHNIPLLR | 0.691 | 0.000 | 0.156 | 0.074 | 0.000 | 0.000 | 0.079 | 0.000 | ||
| 3 spectra, FSSQEAASSFGDDR | 0.907 | 0.000 | 0.000 | 0.000 | 0.000 | 0.000 | 0.000 | 0.093 | ||
| 5 spectra, FIDNPR | 0.938 | 0.000 | 0.000 | 0.000 | 0.000 | 0.000 | 0.000 | 0.062 | ||
| 5 spectra, MADEAVCVGPAPTSK | 0.951 | 0.000 | 0.000 | 0.000 | 0.000 | 0.000 | 0.000 | 0.049 | ||
| 1 spectrum, GDISTK | 0.305 | 0.031 | 0.026 | 0.000 | 0.638 | 0.000 | 0.000 | 0.000 | ||
| 8 spectra, LSQYQEPIHLPGVR | 0.728 | 0.000 | 0.000 | 0.272 | 0.000 | 0.000 | 0.000 | 0.000 | ||
| 4 spectra, GHMLTPSER | 0.568 | 0.062 | 0.031 | 0.000 | 0.065 | 0.218 | 0.056 | 0.000 | ||
| 12 spectra, MEDALDSYVIR | 0.963 | 0.000 | 0.000 | 0.000 | 0.000 | 0.000 | 0.000 | 0.037 | ||
| 3 spectra, EIGYPVMIK | 1.000 | 0.000 | 0.000 | 0.000 | 0.000 | 0.000 | 0.000 | 0.000 | ||
| 4 spectra, YSSAGTVEFLVDSQK | 0.888 | 0.000 | 0.000 | 0.004 | 0.000 | 0.000 | 0.098 | 0.010 | ||
| 37 spectra, ILLANR | 0.945 | 0.000 | 0.000 | 0.000 | 0.000 | 0.000 | 0.000 | 0.055 | ||
| 1 spectrum, AMGEQAVALAK | 0.344 | 0.000 | 0.130 | 0.008 | 0.055 | 0.000 | 0.463 | 0.000 | ||
| 10 spectra, TVQCLSR | 0.916 | 0.000 | 0.000 | 0.000 | 0.000 | 0.000 | 0.000 | 0.084 | ||
| 2 spectra, HIEIQVLGDK | 0.658 | 0.054 | 0.000 | 0.000 | 0.125 | 0.163 | 0.000 | 0.000 | ||
| 2 spectra, FQEHSR | 0.869 | 0.000 | 0.000 | 0.108 | 0.000 | 0.000 | 0.000 | 0.024 | ||
| 11 spectra, VPVIRPDVAK | 0.968 | 0.000 | 0.000 | 0.000 | 0.000 | 0.000 | 0.000 | 0.032 | ||
| 6 spectra, EVIINTR | 0.865 | 0.104 | 0.000 | 0.000 | 0.000 | 0.000 | 0.011 | 0.020 | ||
| 2 spectra, TGAQAVHPGYGFLSENK | 0.929 | 0.000 | 0.000 | 0.000 | 0.000 | 0.000 | 0.013 | 0.057 | ||
| 1 spectrum, FLSDVYPDGFK | 0.973 | 0.000 | 0.000 | 0.000 | 0.000 | 0.000 | 0.000 | 0.027 | ||
| 9 spectra, IAWDDEETR | 0.841 | 0.000 | 0.000 | 0.000 | 0.000 | 0.000 | 0.159 | 0.000 | ||
| 1 spectrum, VVEEAPSIFLDPETR | 0.120 | 0.000 | 0.385 | 0.000 | 0.168 | 0.074 | 0.253 | 0.000 | ||
| 1 spectrum, QEDIPISGWAVECR | 0.462 | 0.209 | 0.007 | 0.000 | 0.000 | 0.000 | 0.322 | 0.000 | ||
| 8 spectra, ECSIQR | 0.678 | 0.090 | 0.000 | 0.000 | 0.212 | 0.000 | 0.019 | 0.000 | ||
| 4 spectra, HGNALWLNER | 0.828 | 0.000 | 0.000 | 0.121 | 0.032 | 0.000 | 0.000 | 0.019 | ||
| 5 spectra, SYLNMDAIMEAIK | 0.921 | 0.000 | 0.000 | 0.000 | 0.000 | 0.000 | 0.000 | 0.079 | ||
| 12 spectra, SFGLPSIGR | 0.857 | 0.038 | 0.000 | 0.000 | 0.056 | 0.049 | 0.000 | 0.000 | ||
| 3 spectra, VYAEDPYK | 0.898 | 0.000 | 0.000 | 0.000 | 0.000 | 0.000 | 0.000 | 0.102 | ||
| 12 spectra, NFYFLEMNTR | 0.966 | 0.000 | 0.000 | 0.000 | 0.000 | 0.000 | 0.009 | 0.025 |
| Plot | Mito | Lyso or Perox | ER | Golgi | PM | Cytosol | Nucleus | ||||||
| Expt B |
24 peptides |
105 spectra |
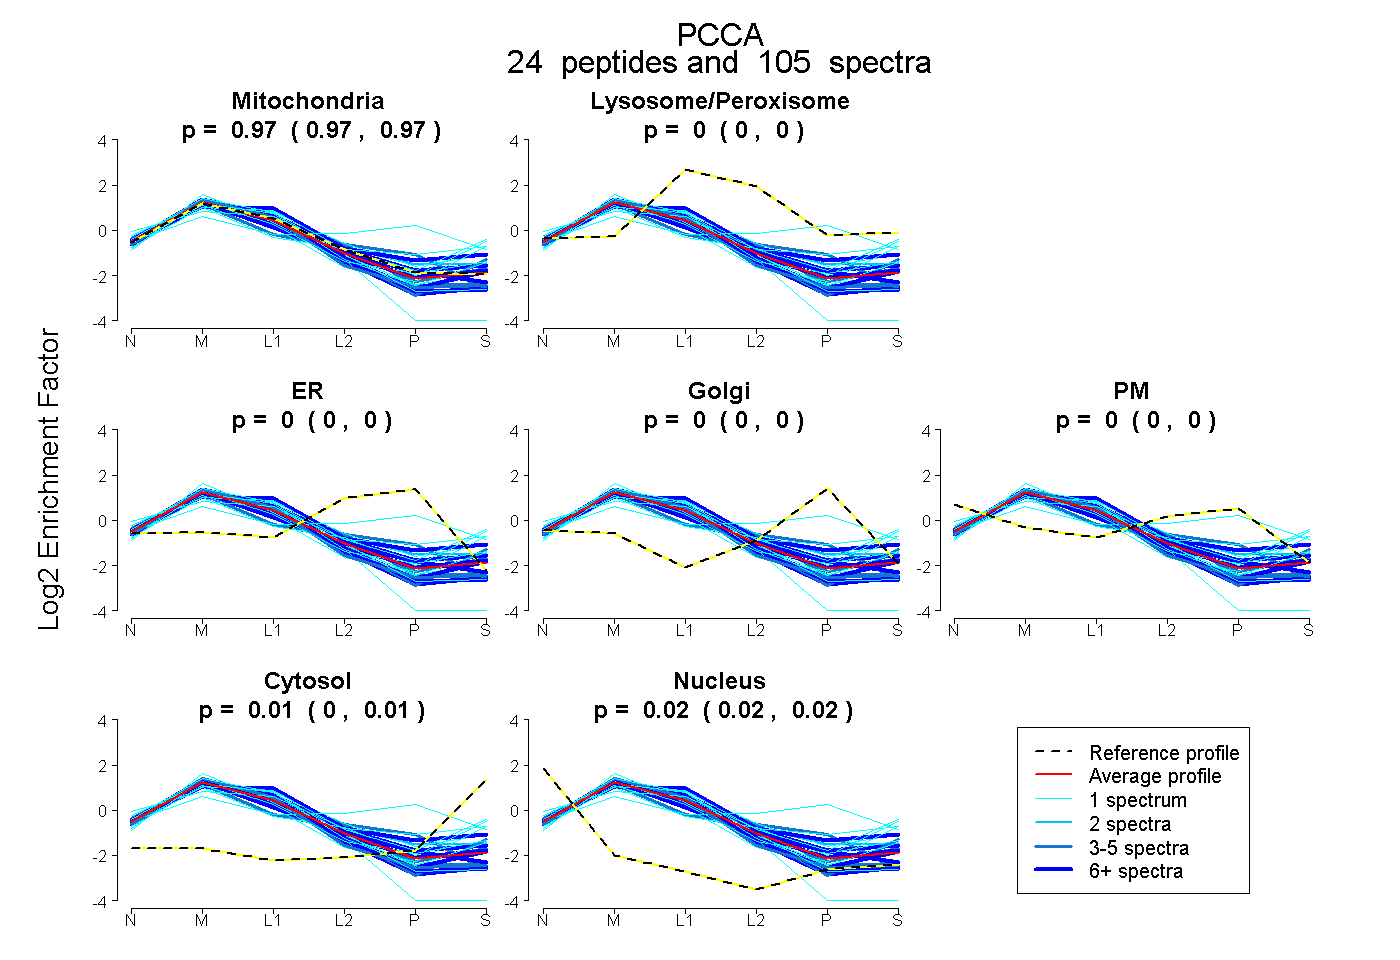 |
0.970 0.968 | 0.973 |
0.000 0.000 | 0.000 |
0.000 0.000 | 0.000 |
0.000 0.000 | 0.000 |
0.000 0.000 | 0.000 |
0.010 0.005 | 0.014 |
0.019 0.016 | 0.022 |
|||
| Plot | Lyso | Other | |||||||||||
| Expt C |
34 peptides |
686 spectra |
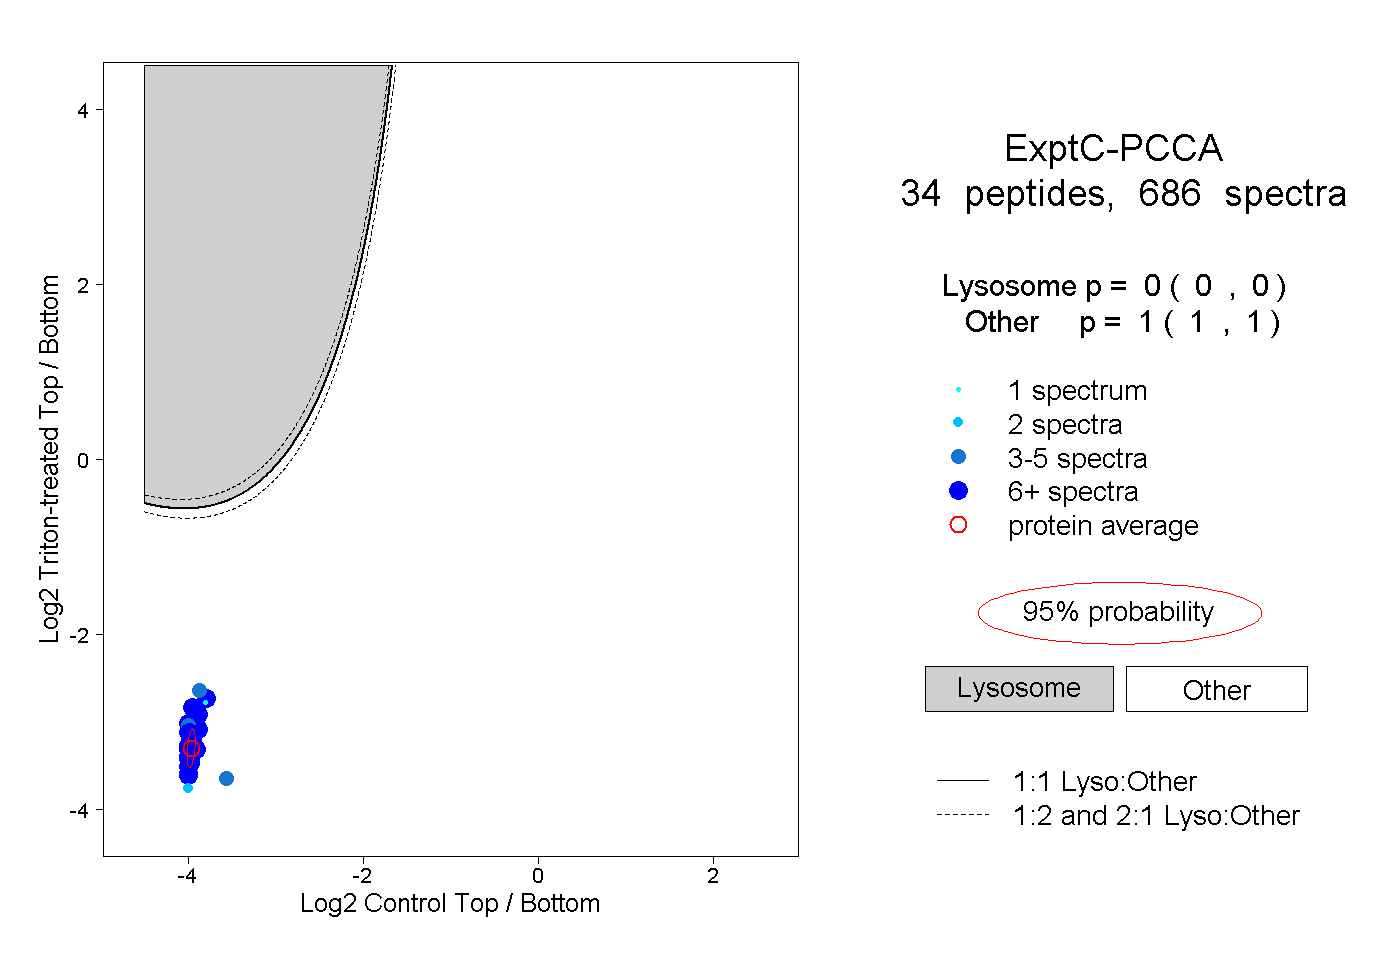 |
0.000 0.000 | 0.000 |
1.000 1.000 | 1.000 |
||||||||
| Plot | Lyso | Other | |||||||||||
| Expt D |
16 peptides |
45 spectra |
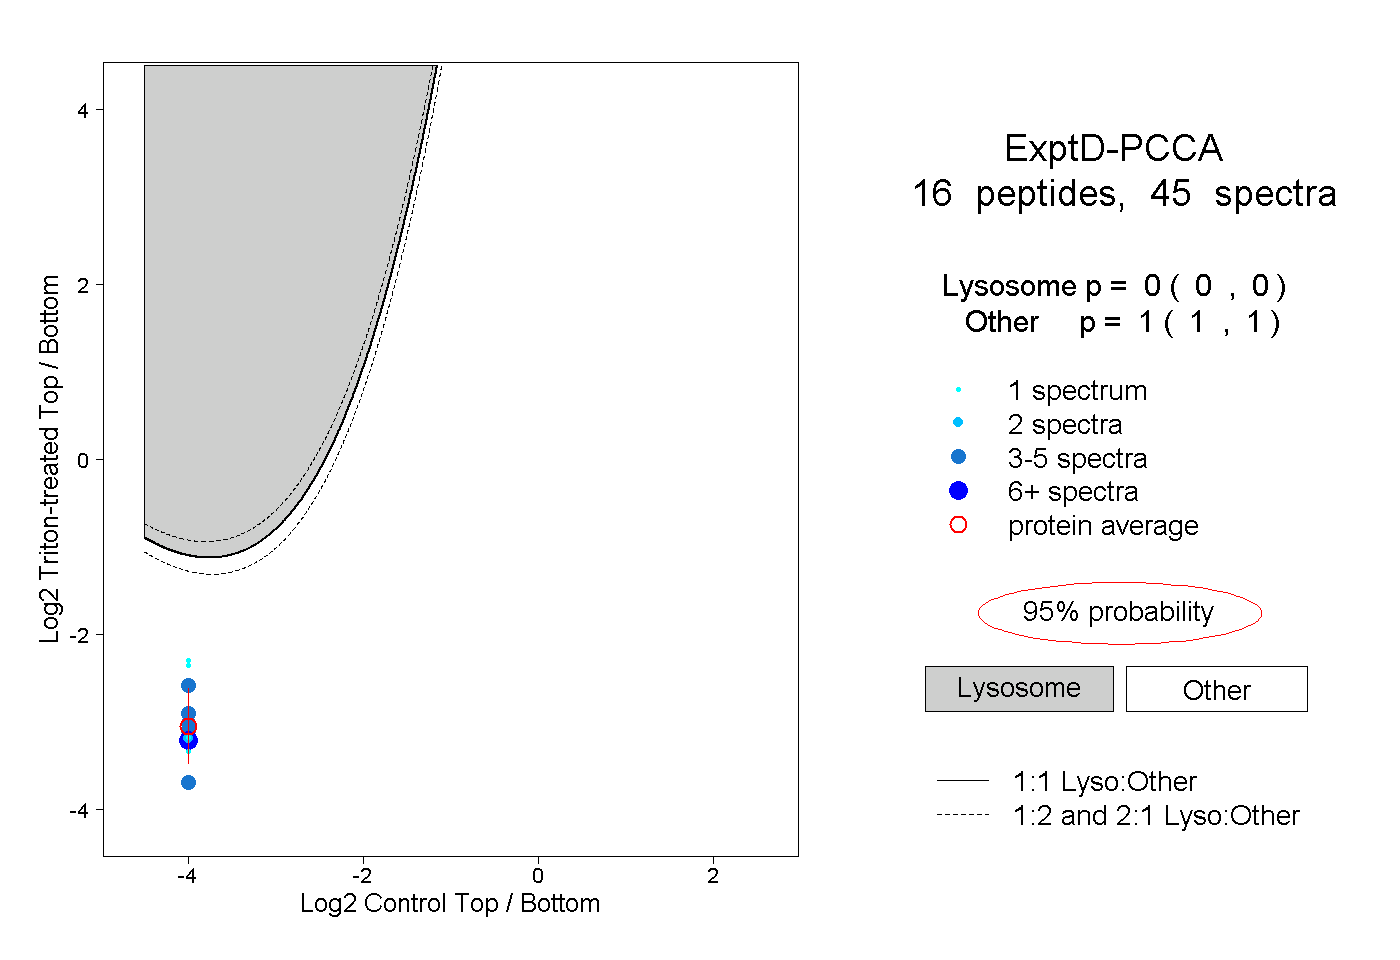 |
0.000 0.000 | 0.000 |
1.000 1.000 | 1.000 |