37
37peptides
spectra
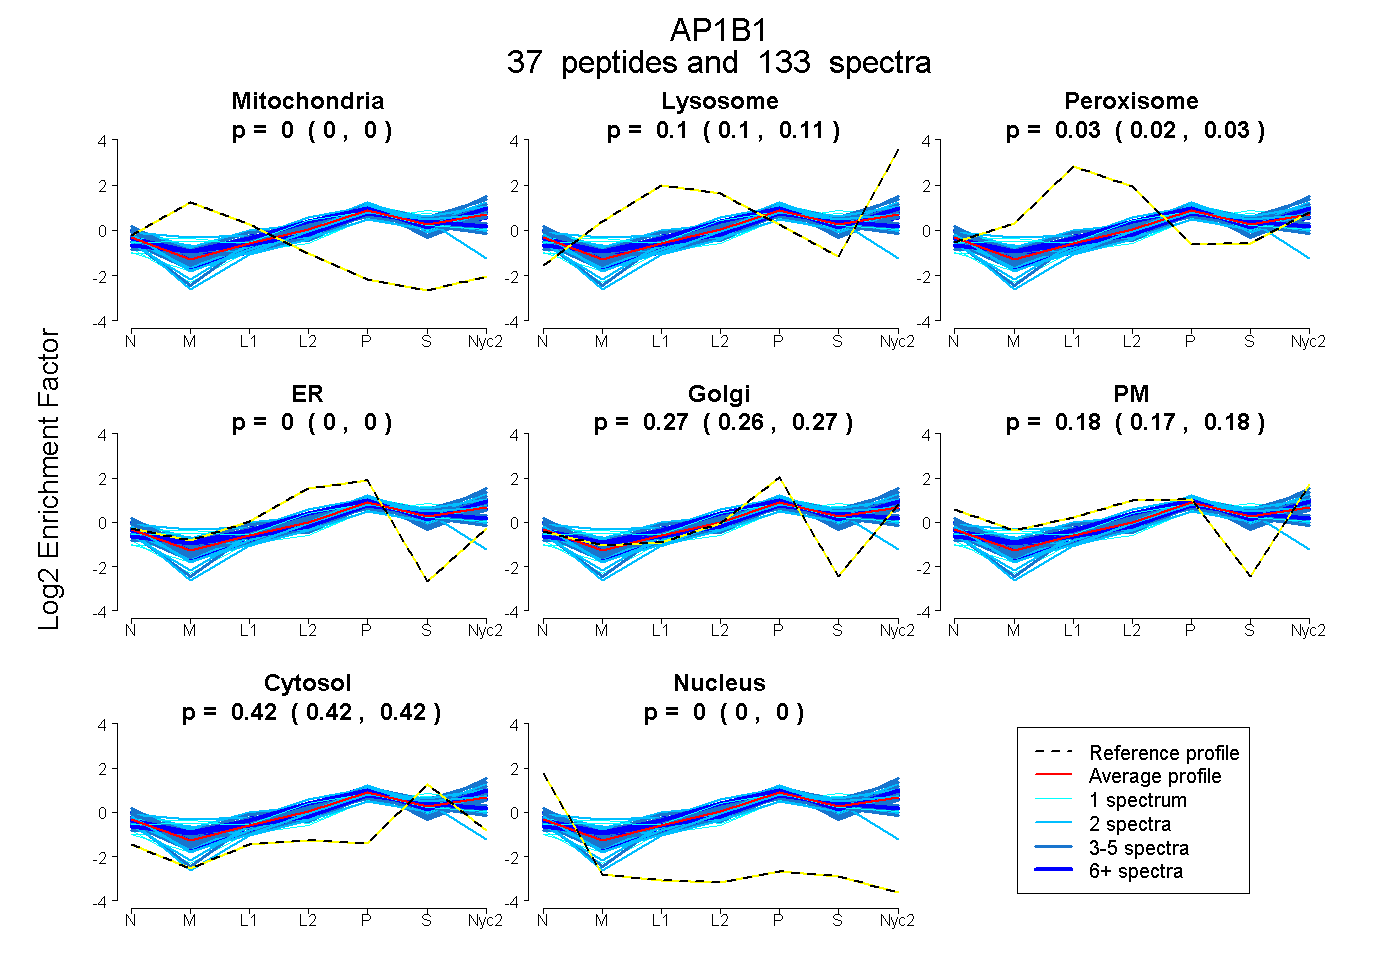
0.000 | 0.000
0.100 | 0.108
0.021 | 0.030
0.000 | 0.000
0.264 | 0.274
0.172 | 0.184
0.420 | 0.423
0.000 | 0.000
8peptides
spectra
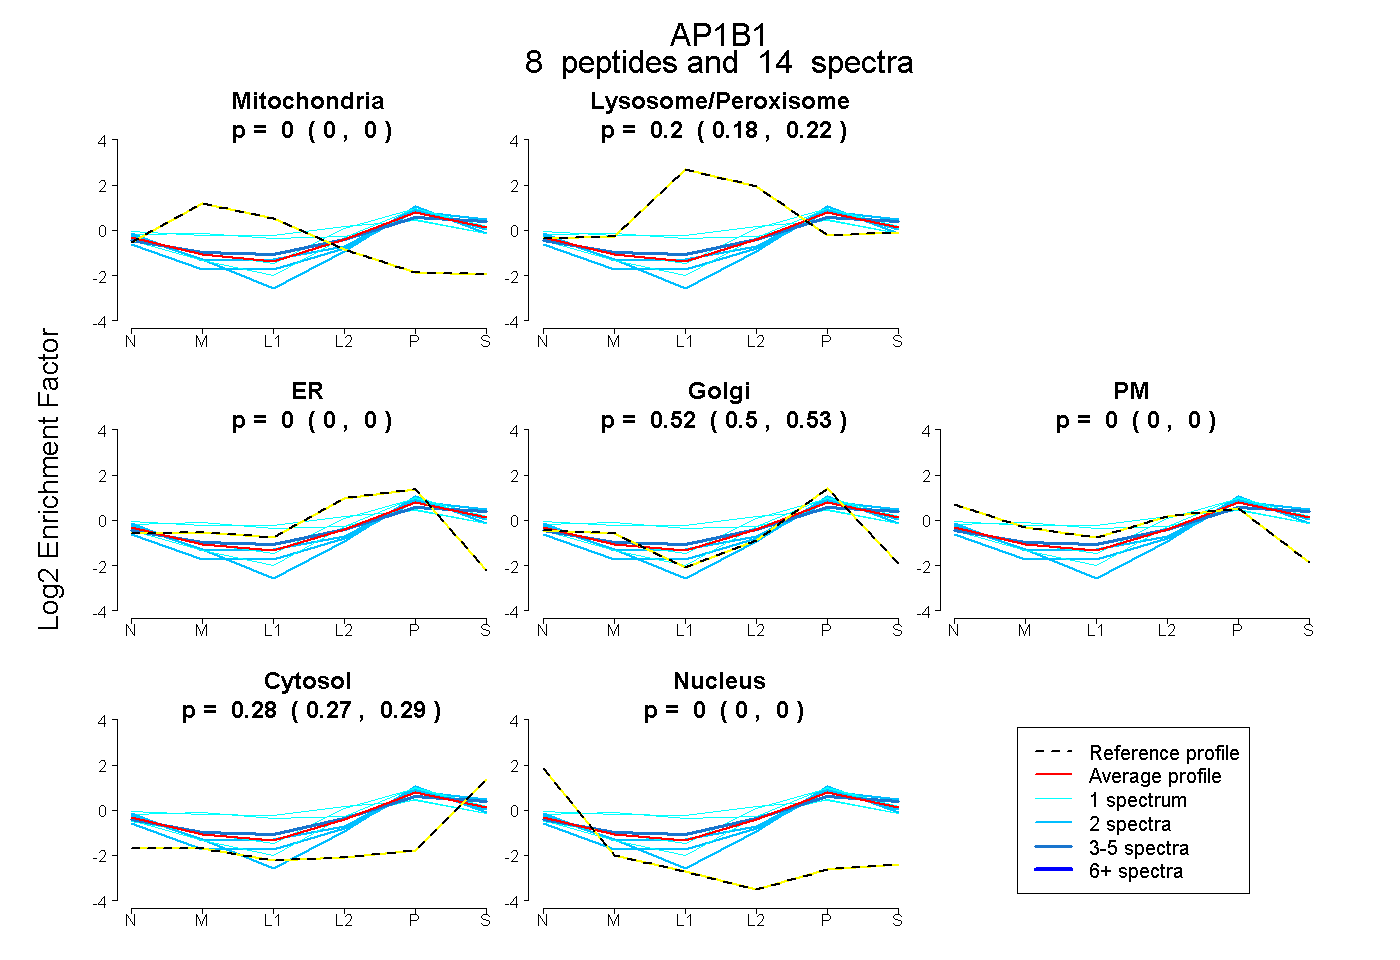
0.000 | 0.000
0.182 | 0.221
0.000 | 0.000
0.500 | 0.530
0.000 | 0.000
0.267 | 0.291
0.000 | 0.000