 1
1peptide
spectra
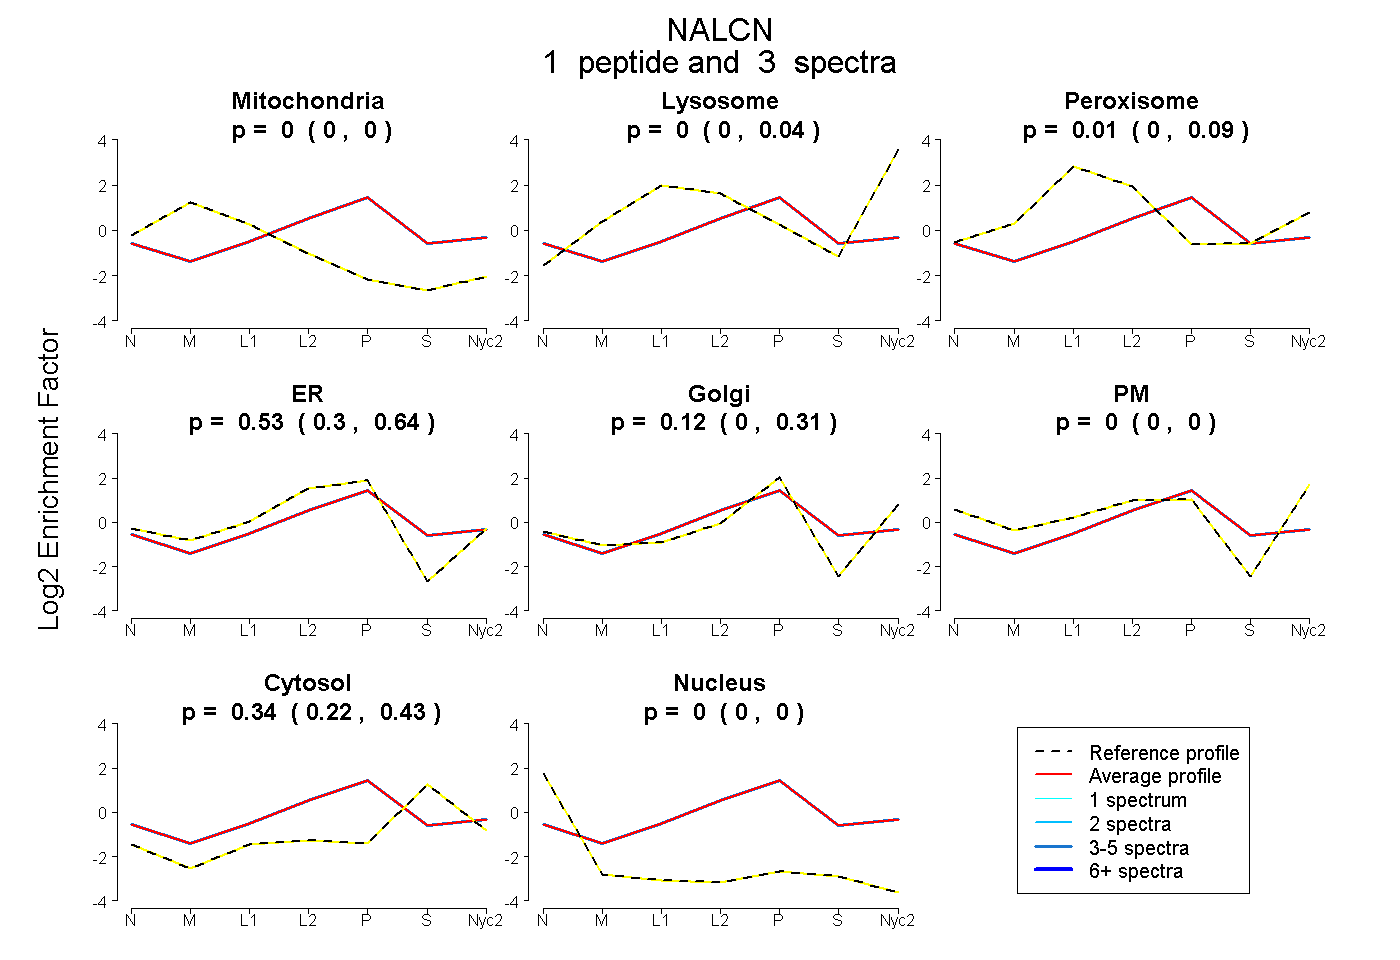
0.000 | 0.000
0.000 | 0.037
0.000 | 0.090
0.302 | 0.645
0.000 | 0.306
0.000 | 0.000
0.224 | 0.425
0.000 | 0.000
1peptide
spectrum
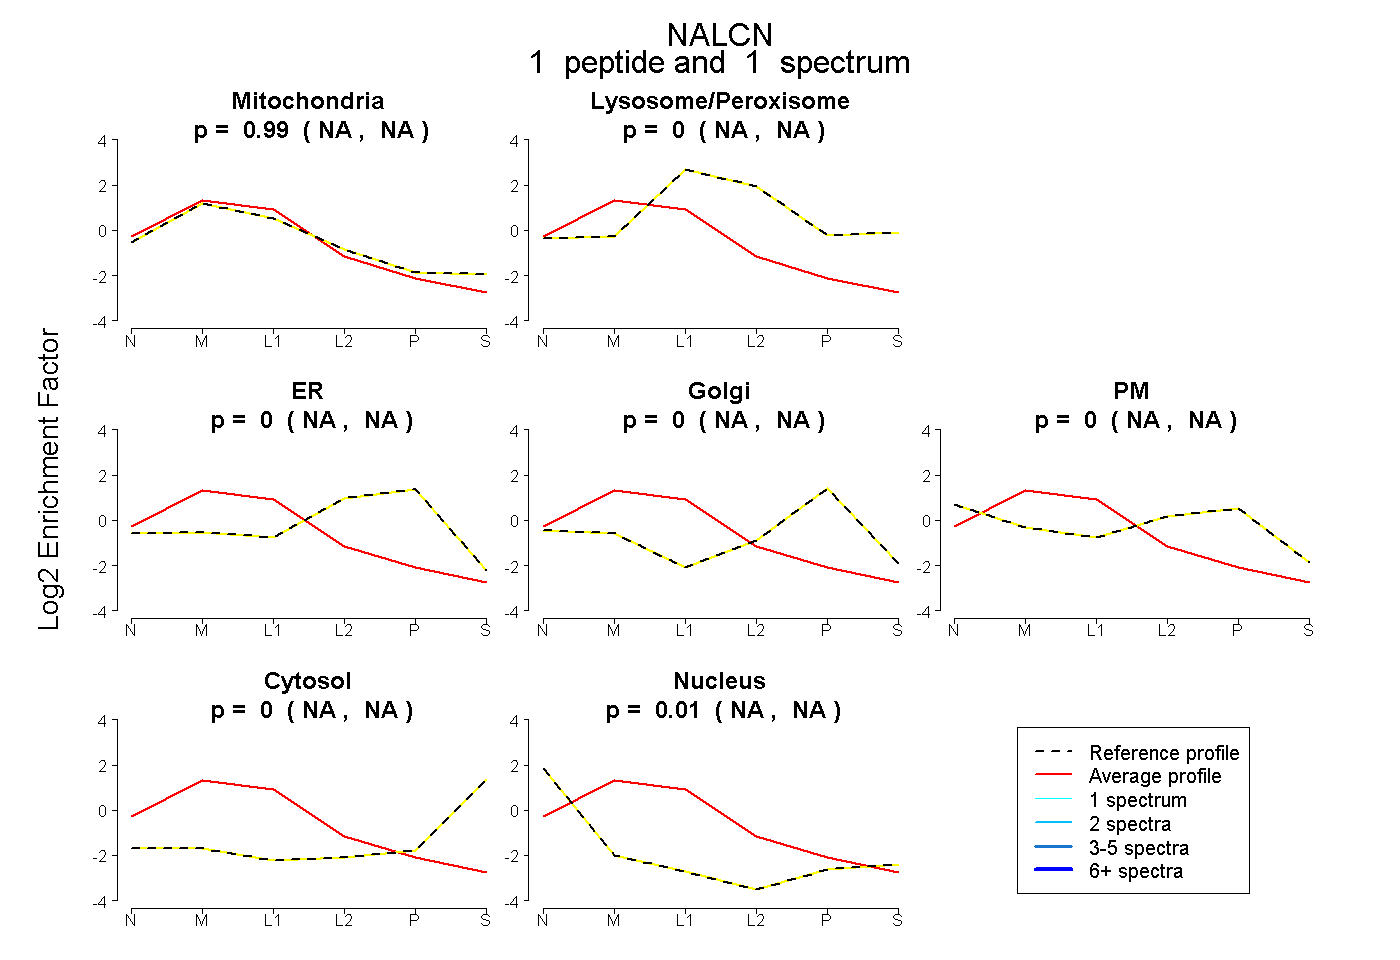
NA | NA
NA | NA
NA | NA
NA | NA
NA | NA
NA | NA
NA | NA
3peptides
spectra
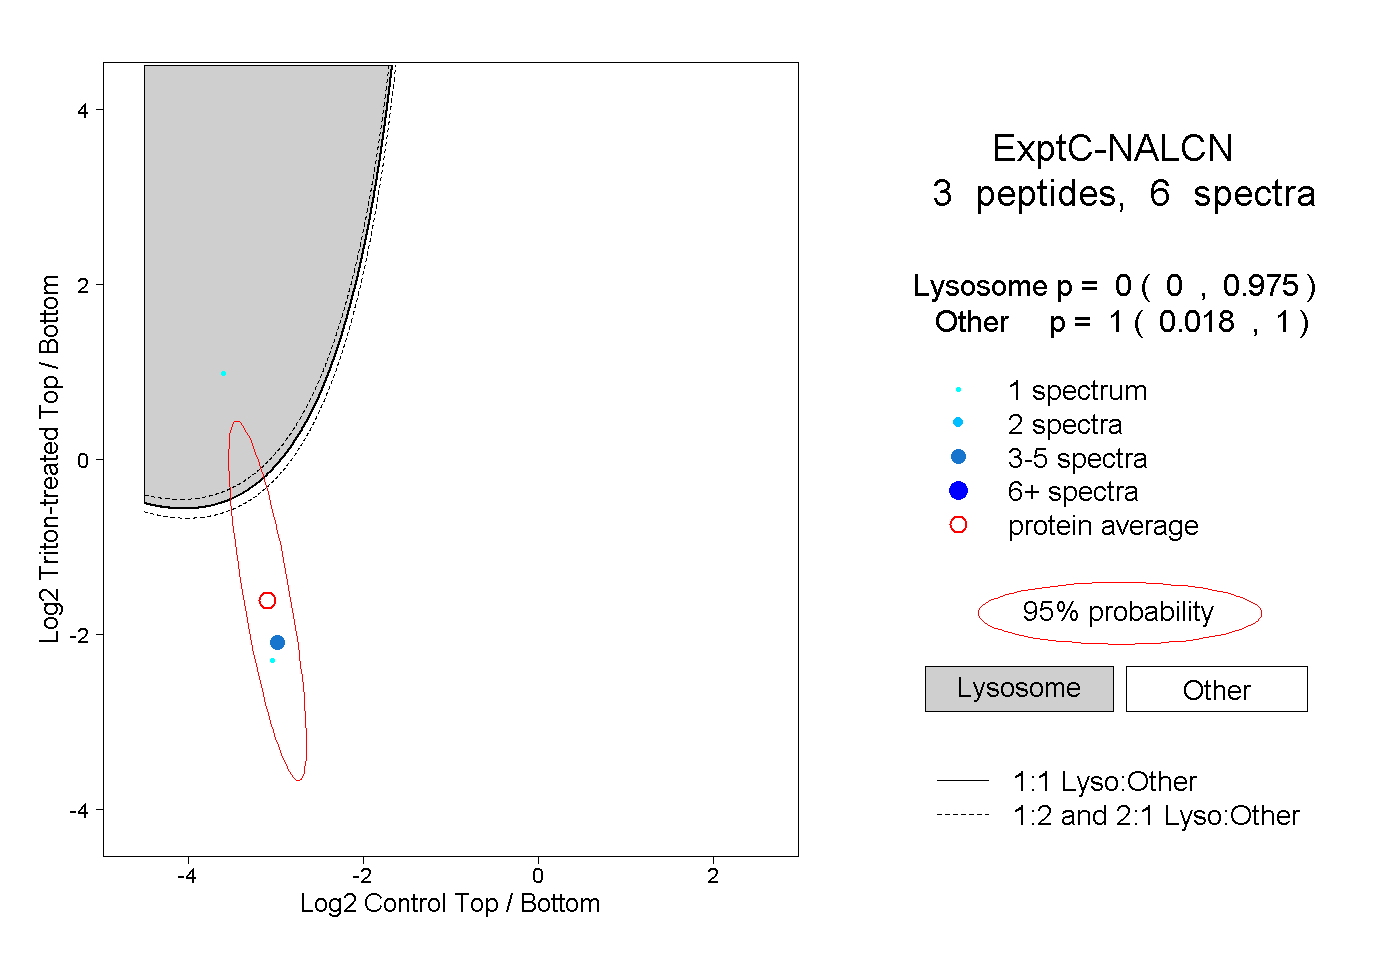
0.000 | 0.975
0.018 | 1.000