 7
7peptides
spectra
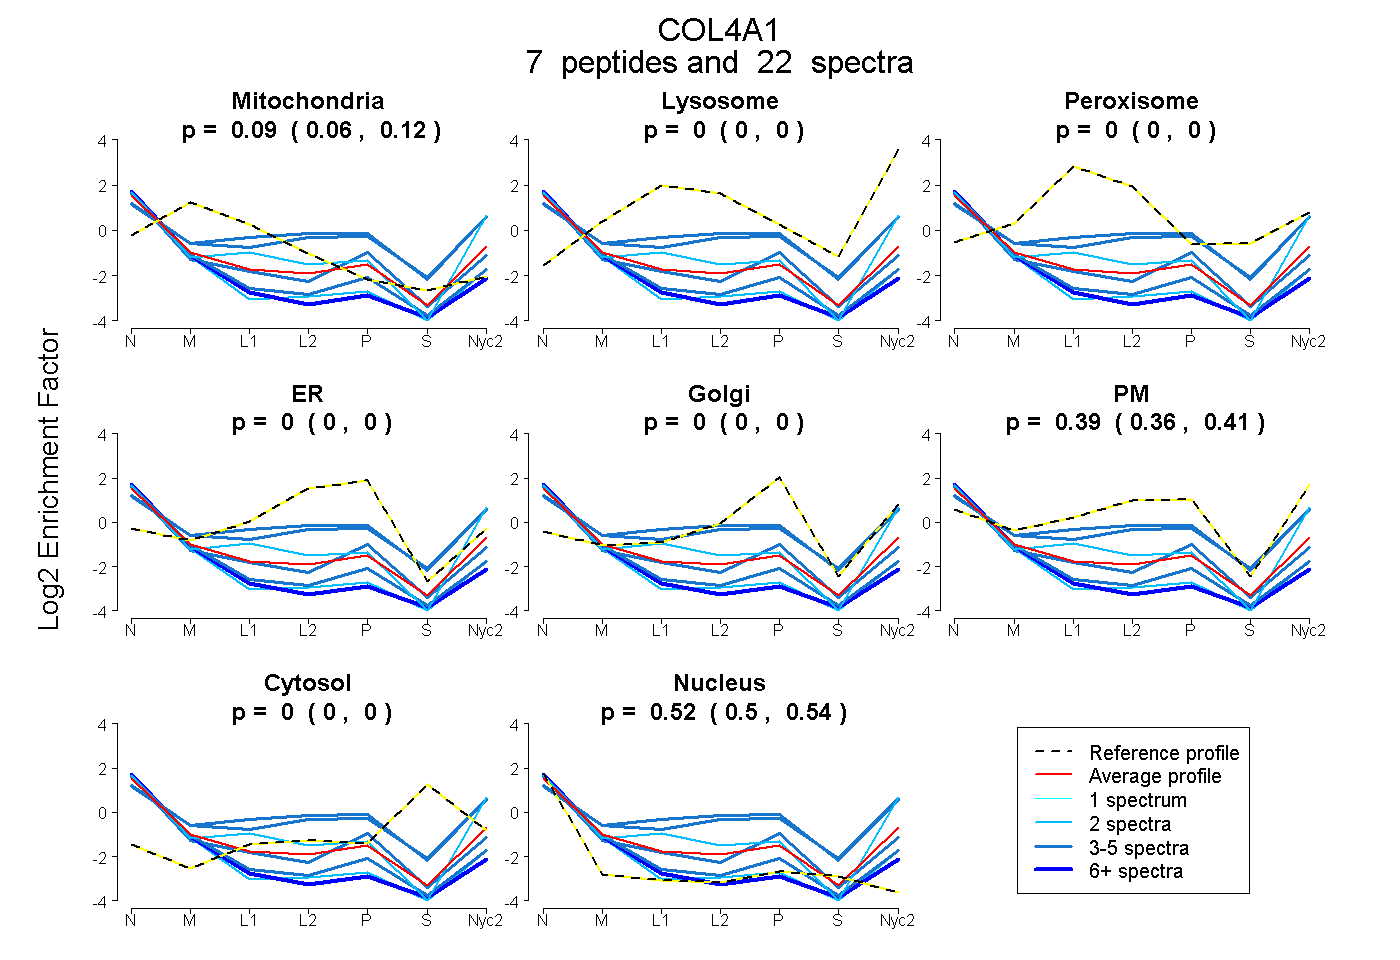
0.063 | 0.119
0.000 | 0.000
0.000 | 0.000
0.000 | 0.000
0.000 | 0.000
0.356 | 0.413
0.000 | 0.000
0.499 | 0.537
2peptides
spectra
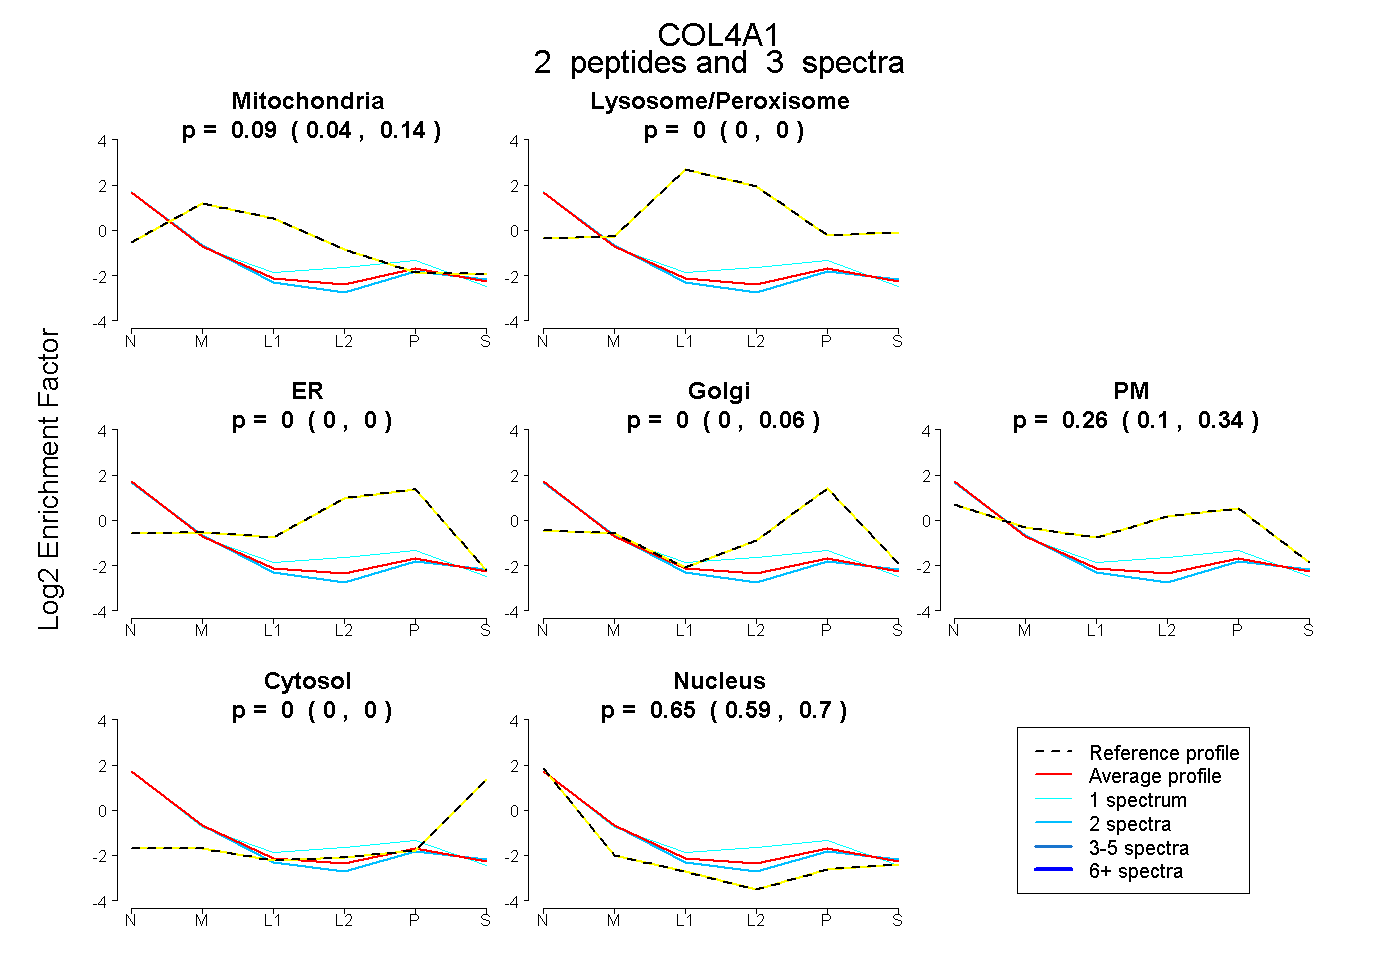
0.037 | 0.142
0.000 | 0.000
0.000 | 0.000
0.000 | 0.063
0.102 | 0.344
0.000 | 0.000
0.586 | 0.700
8peptides
spectra
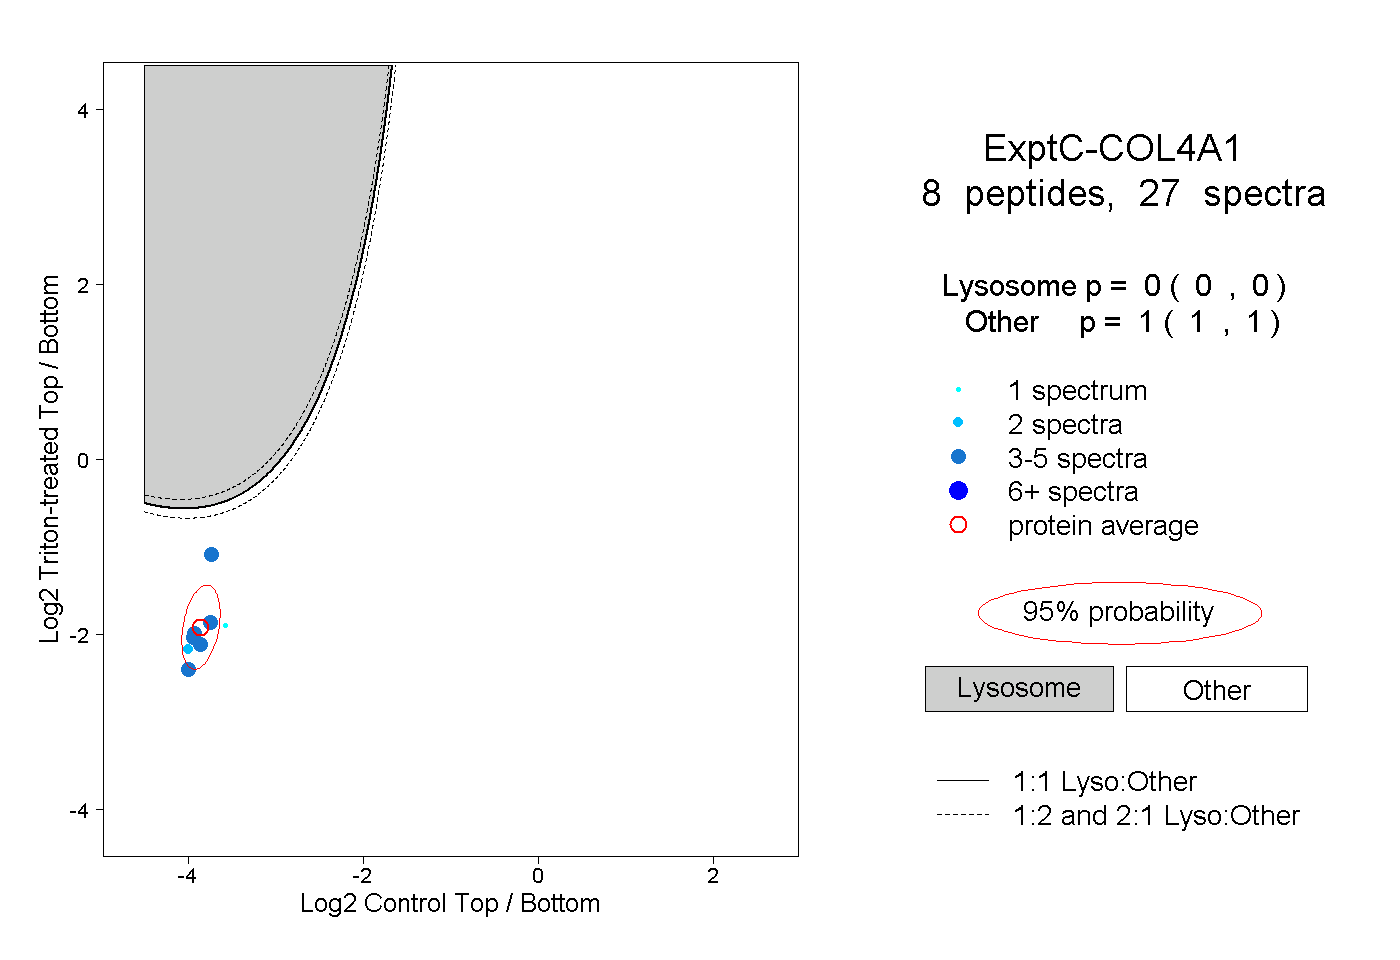
0.000 | 0.000
1.000 | 1.000