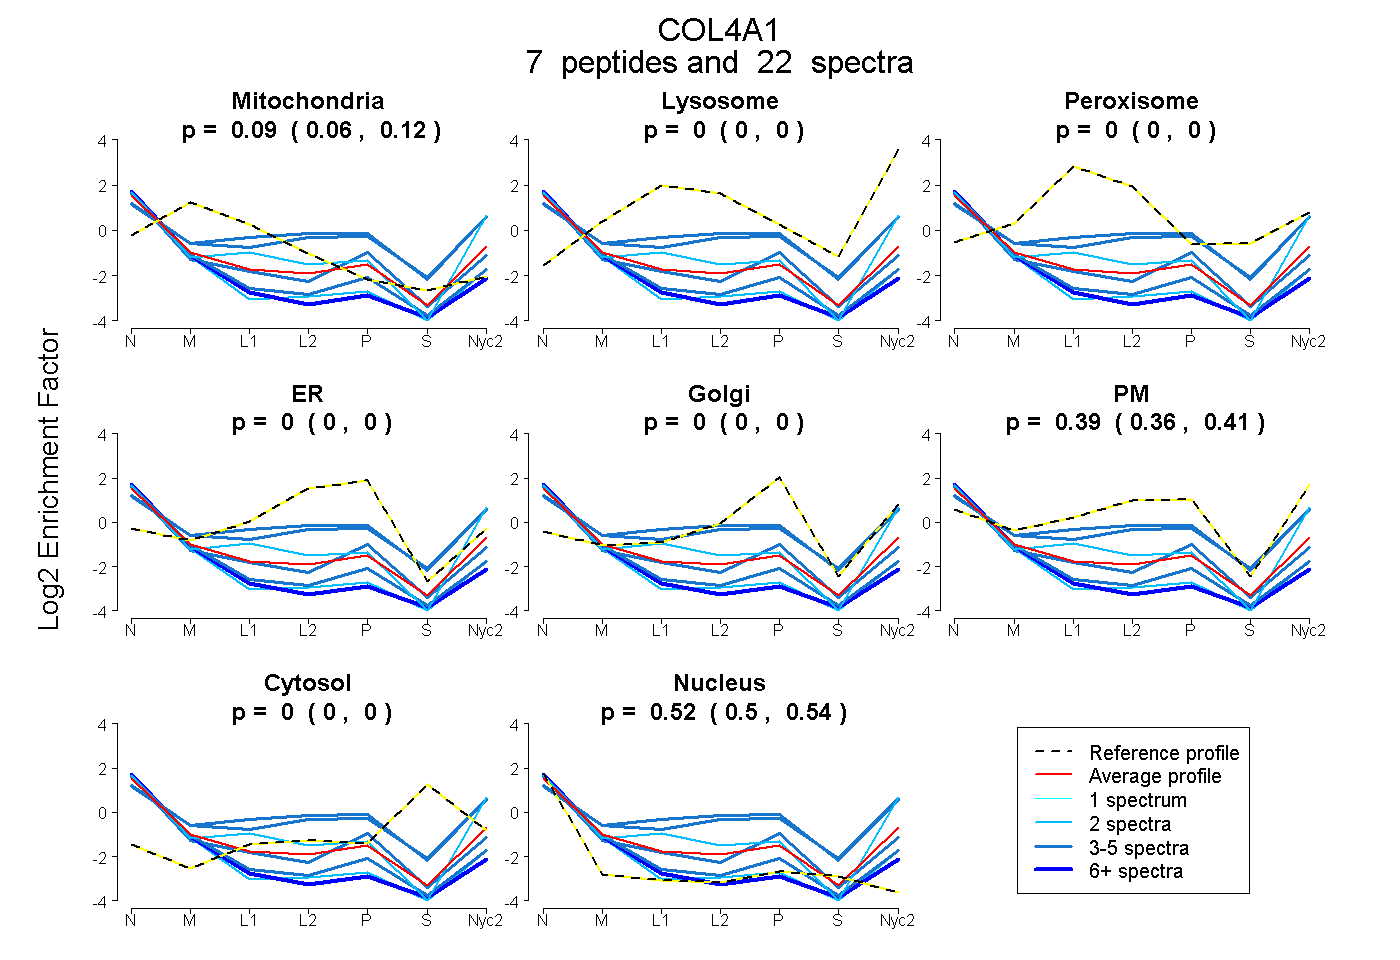
 7
7peptides
spectra
0.063 | 0.119
0.000 | 0.000
0.000 | 0.000
0.000 | 0.000
0.000 | 0.000
0.356 | 0.413
0.000 | 0.000
0.499 | 0.537
| Plot | Mito | Lyso | Perox | ER | Golgi | PM | Cytosol | Nucleus | |||||
| Expt A |
7 peptides |
22 spectra |
|
0.094 0.063 | 0.119 |
0.000 0.000 | 0.000 |
0.000 0.000 | 0.000 |
0.000 0.000 | 0.000 |
0.000 0.000 | 0.000 |
0.386 0.356 | 0.413 |
0.000 0.000 | 0.000 |
0.519 0.499 | 0.537 |
| 6 spectra, GSPGVSLPGPSGR | 0.228 | 0.000 | 0.000 | 0.000 | 0.000 | 0.024 | 0.000 | 0.748 | ||
| 2 spectra, SAPFIECHGR | 0.000 | 0.000 | 0.000 | 0.000 | 0.000 | 0.580 | 0.000 | 0.420 | ||
| 3 spectra, CQVCMR | 0.023 | 0.000 | 0.000 | 0.000 | 0.009 | 0.380 | 0.000 | 0.588 | ||
| 2 spectra, GPPGGVGFPGSR | 0.137 | 0.000 | 0.000 | 0.000 | 0.000 | 0.113 | 0.000 | 0.750 | ||
| 3 spectra, HSQTTDDPLCPPGTK | 0.030 | 0.000 | 0.066 | 0.000 | 0.000 | 0.684 | 0.000 | 0.220 | ||
| 3 spectra, AHGQDLGTAGSCLR | 0.020 | 0.076 | 0.000 | 0.000 | 0.000 | 0.622 | 0.015 | 0.267 | ||
| 3 spectra, GYPGSPGLR | 0.145 | 0.000 | 0.000 | 0.000 | 0.000 | 0.166 | 0.000 | 0.689 |
| Plot | Mito | Lyso or Perox | ER | Golgi | PM | Cytosol | Nucleus | ||||||
| Expt B |
2 peptides |
3 spectra |
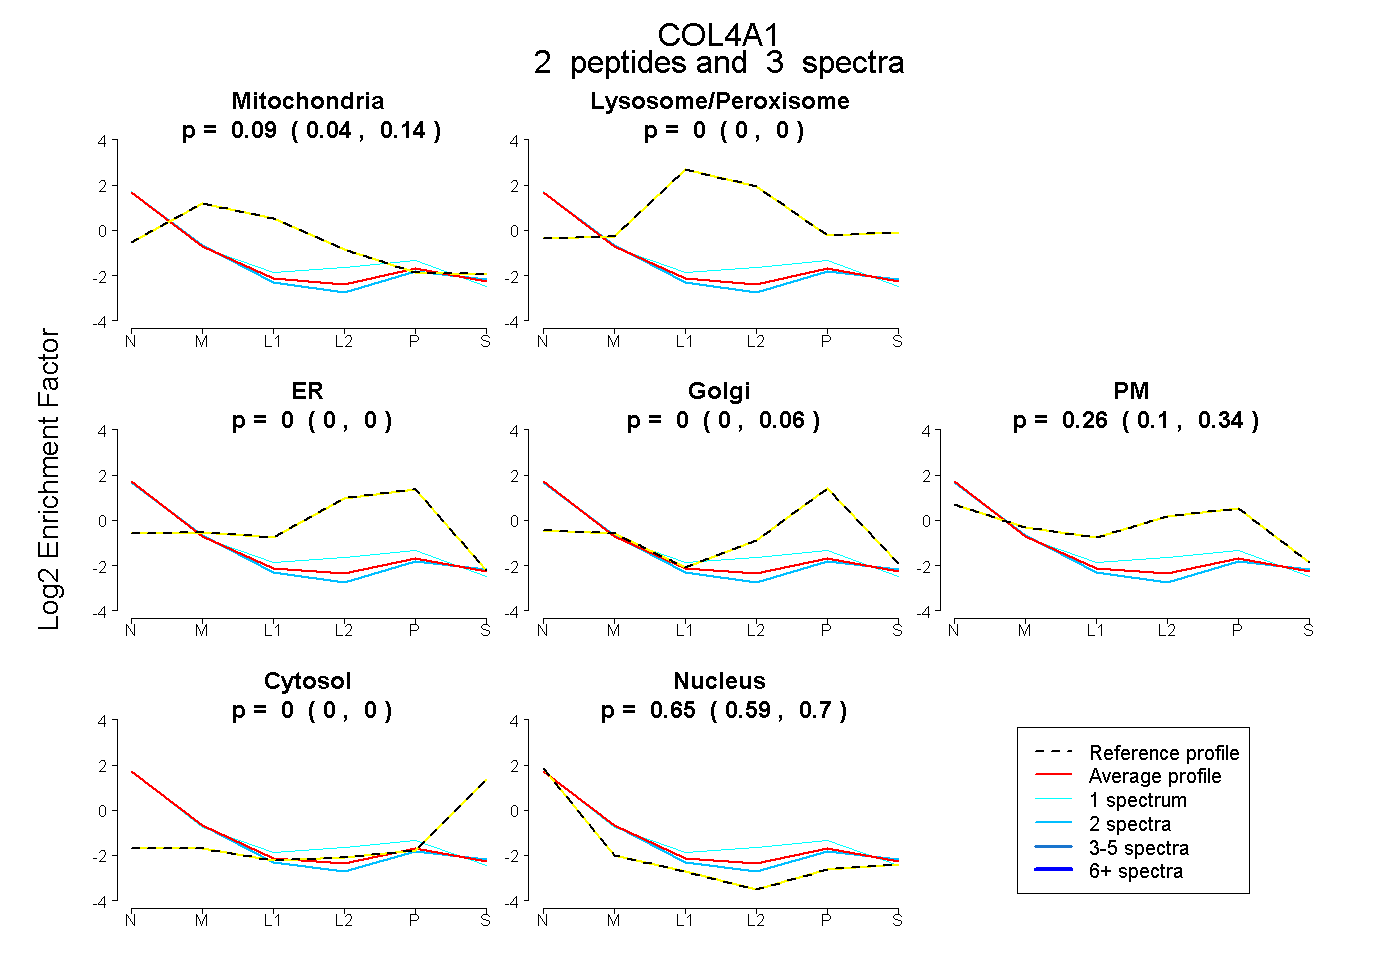 |
0.092 0.037 | 0.142 |
0.000 0.000 | 0.000 |
0.000 0.000 | 0.000 |
0.000 0.000 | 0.063 |
0.257 0.102 | 0.344 |
0.000 0.000 | 0.000 |
0.651 0.586 | 0.700 |
|||
| Plot | Lyso | Other | |||||||||||
| Expt C |
8 peptides |
27 spectra |
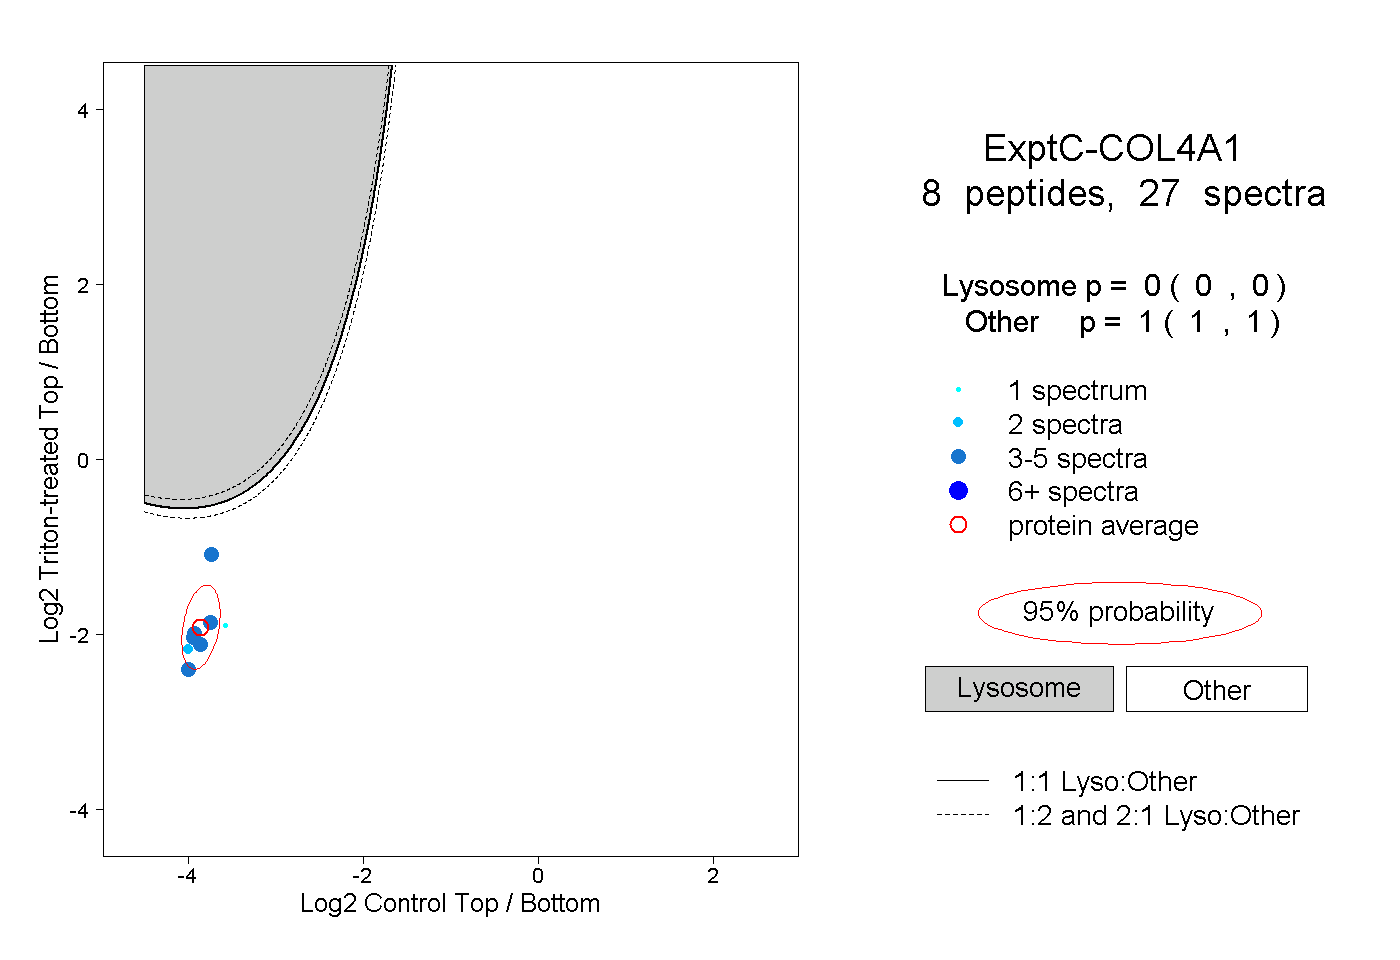 |
0.000 0.000 | 0.000 |
1.000 1.000 | 1.000 |