 9
9peptides
spectra
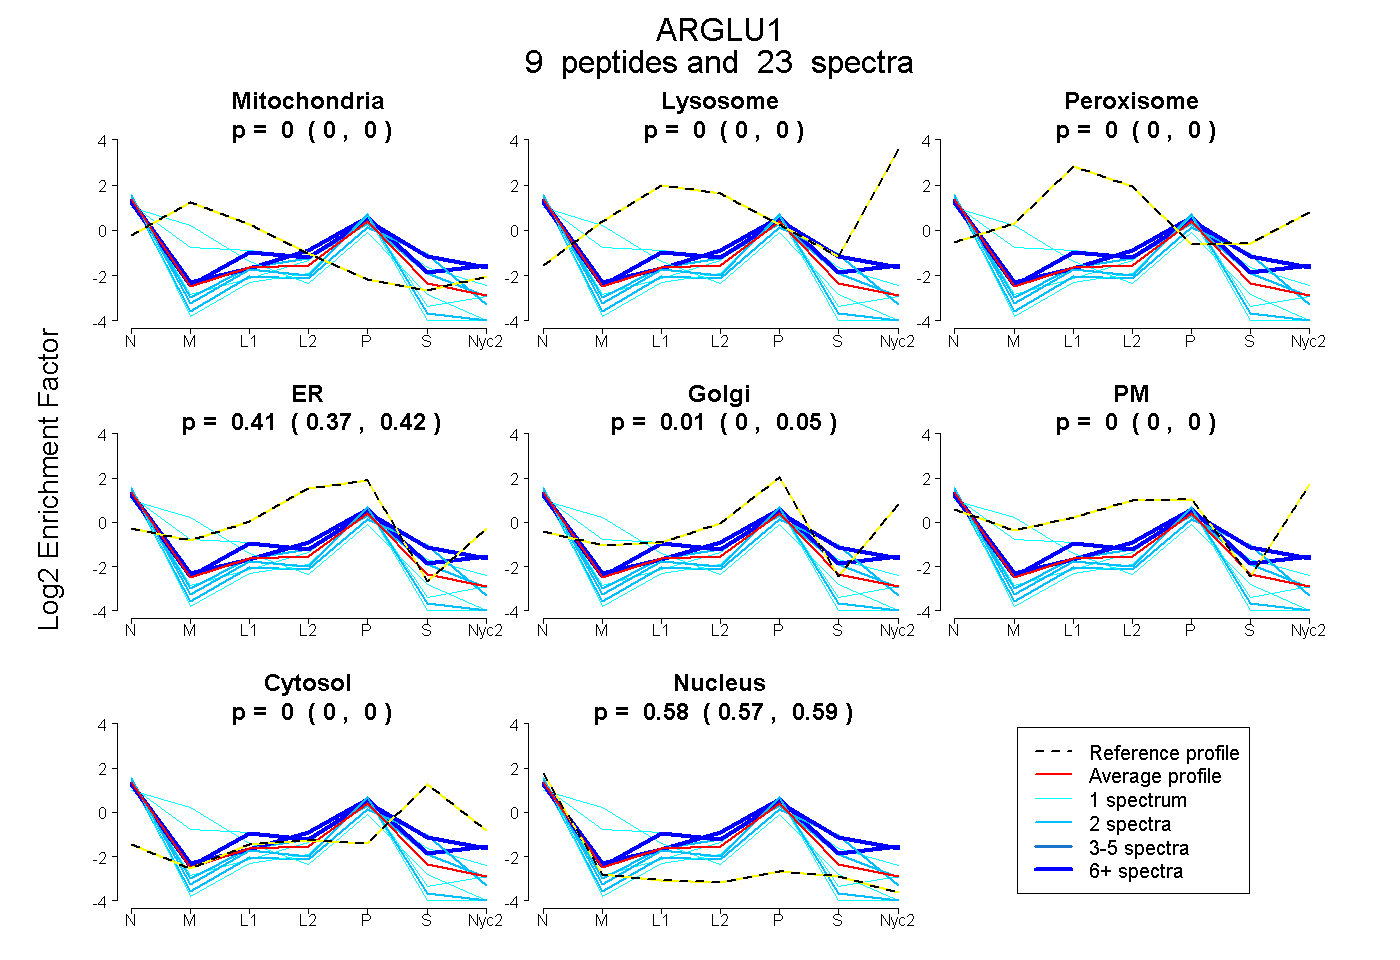
0.000 | 0.000
0.000 | 0.000
0.000 | 0.000
0.365 | 0.420
0.000 | 0.052
0.000 | 0.000
0.000 | 0.000
0.569 | 0.591
| Plot | Mito | Lyso | Perox | ER | Golgi | PM | Cytosol | Nucleus | |||||
| Expt A |
9 peptides |
23 spectra |
|
0.000 0.000 | 0.000 |
0.000 0.000 | 0.000 |
0.000 0.000 | 0.000 |
0.407 0.365 | 0.420 |
0.010 0.000 | 0.052 |
0.000 0.000 | 0.000 |
0.000 0.000 | 0.000 |
0.582 0.569 | 0.591 |
| 1 spectrum, QLLEELER | 0.000 | 0.000 | 0.000 | 0.278 | 0.000 | 0.000 | 0.000 | 0.722 | ||
| 7 spectra, QAELAAQK | 0.000 | 0.000 | 0.000 | 0.296 | 0.143 | 0.000 | 0.217 | 0.344 | ||
| 2 spectra, IVEEQR | 0.000 | 0.000 | 0.000 | 0.177 | 0.000 | 0.000 | 0.233 | 0.590 | ||
| 2 spectra, VEEELEK | 0.000 | 0.000 | 0.000 | 0.318 | 0.000 | 0.000 | 0.000 | 0.682 | ||
| 1 spectrum, ASSPPDR | 0.000 | 0.000 | 0.000 | 0.405 | 0.000 | 0.000 | 0.000 | 0.595 | ||
| 6 spectra, ILEENNR | 0.000 | 0.000 | 0.000 | 0.253 | 0.283 | 0.000 | 0.055 | 0.409 | ||
| 1 spectrum, LIEEETAR | 0.400 | 0.000 | 0.000 | 0.152 | 0.000 | 0.000 | 0.000 | 0.448 | ||
| 1 spectrum, IAEAQAK | 0.159 | 0.000 | 0.000 | 0.421 | 0.000 | 0.000 | 0.062 | 0.358 | ||
| 2 spectra, IDIFGR | 0.000 | 0.000 | 0.000 | 0.386 | 0.000 | 0.000 | 0.053 | 0.561 |
| Plot | Mito | Lyso or Perox | ER | Golgi | PM | Cytosol | Nucleus | ||||||
| Expt B |
3 peptides |
5 spectra |
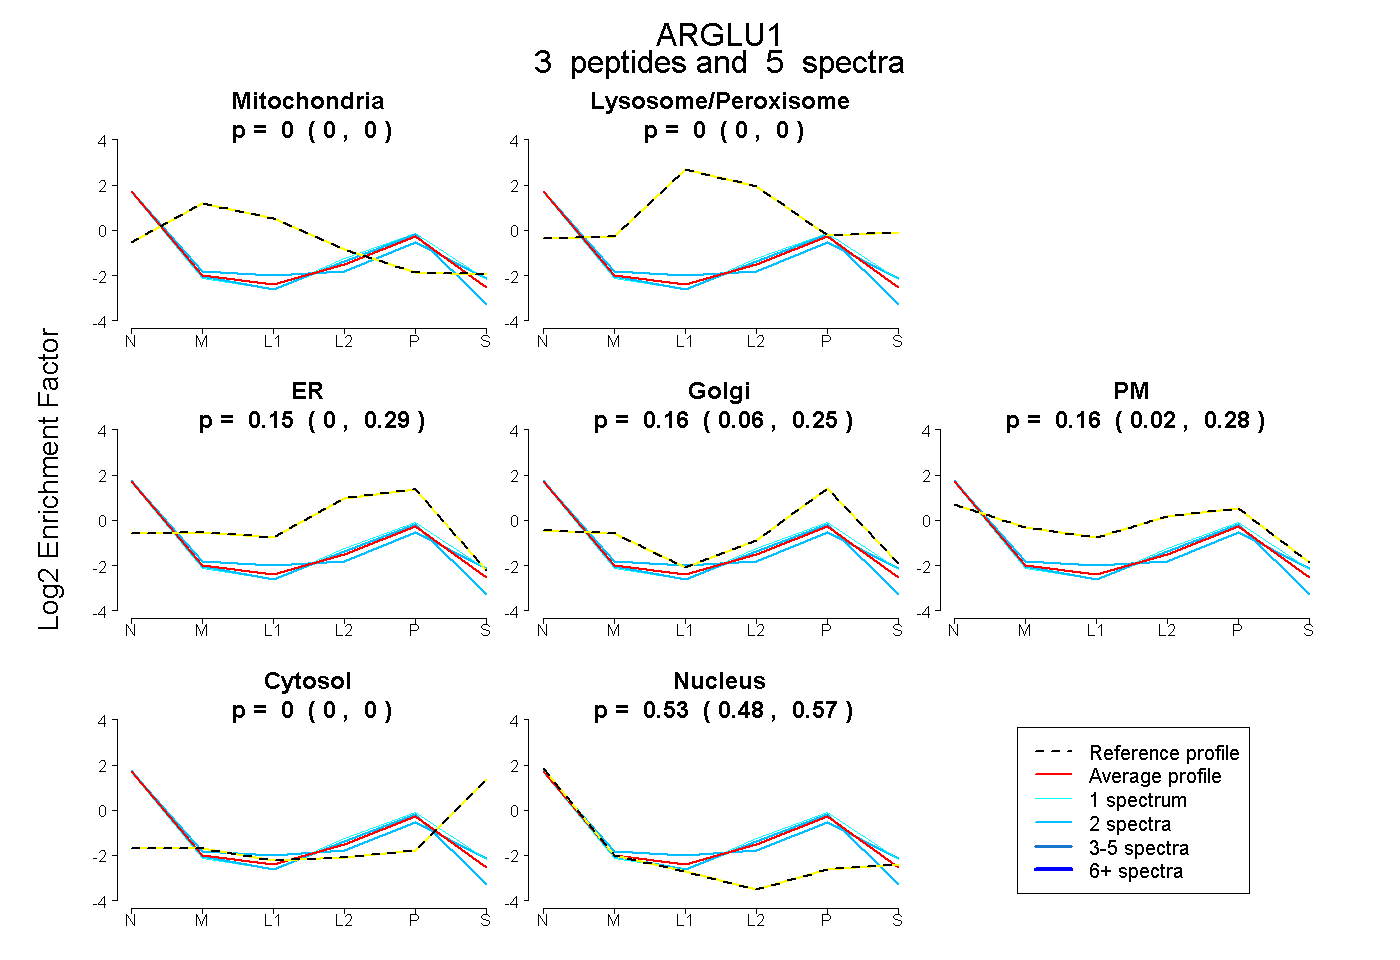 |
0.000 0.000 | 0.000 |
0.000 0.000 | 0.000 |
0.148 0.000 | 0.293 |
0.160 0.060 | 0.246 |
0.163 0.020 | 0.278 |
0.000 0.000 | 0.000 |
0.530 0.480 | 0.574 |
|||
| Plot | Lyso | Other | |||||||||||
| Expt C |
3 peptides |
6 spectra |
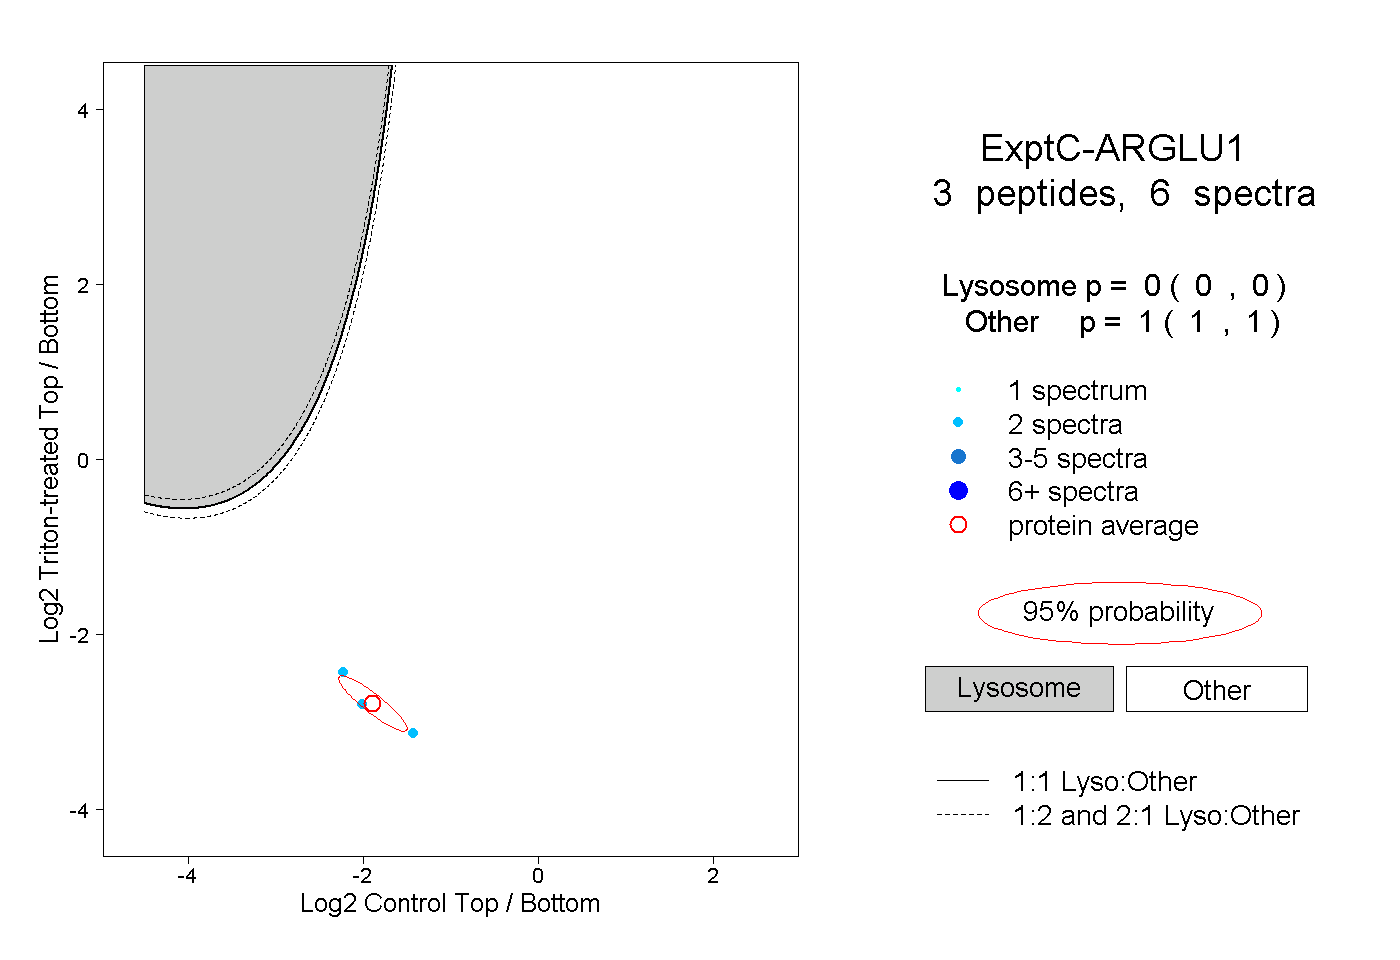 |
0.000 0.000 | 0.000 |
1.000 1.000 | 1.000 |