 38
38peptides
spectra
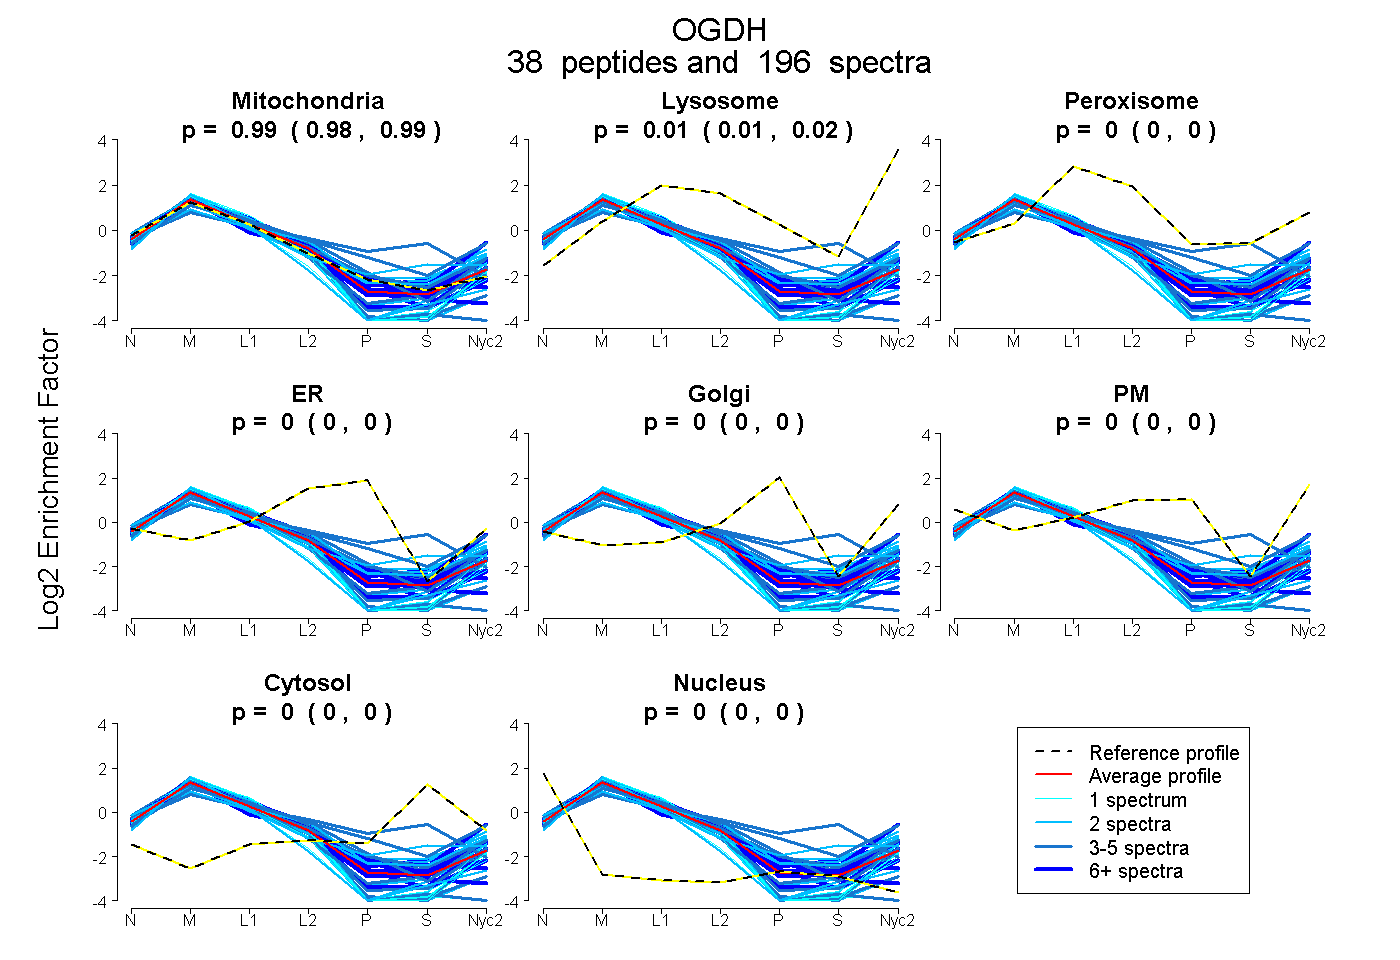
0.983 | 0.987
0.012 | 0.016
0.000 | 0.000
0.000 | 0.000
0.000 | 0.000
0.000 | 0.000
0.000 | 0.000
0.000 | 0.000
25peptides
spectra
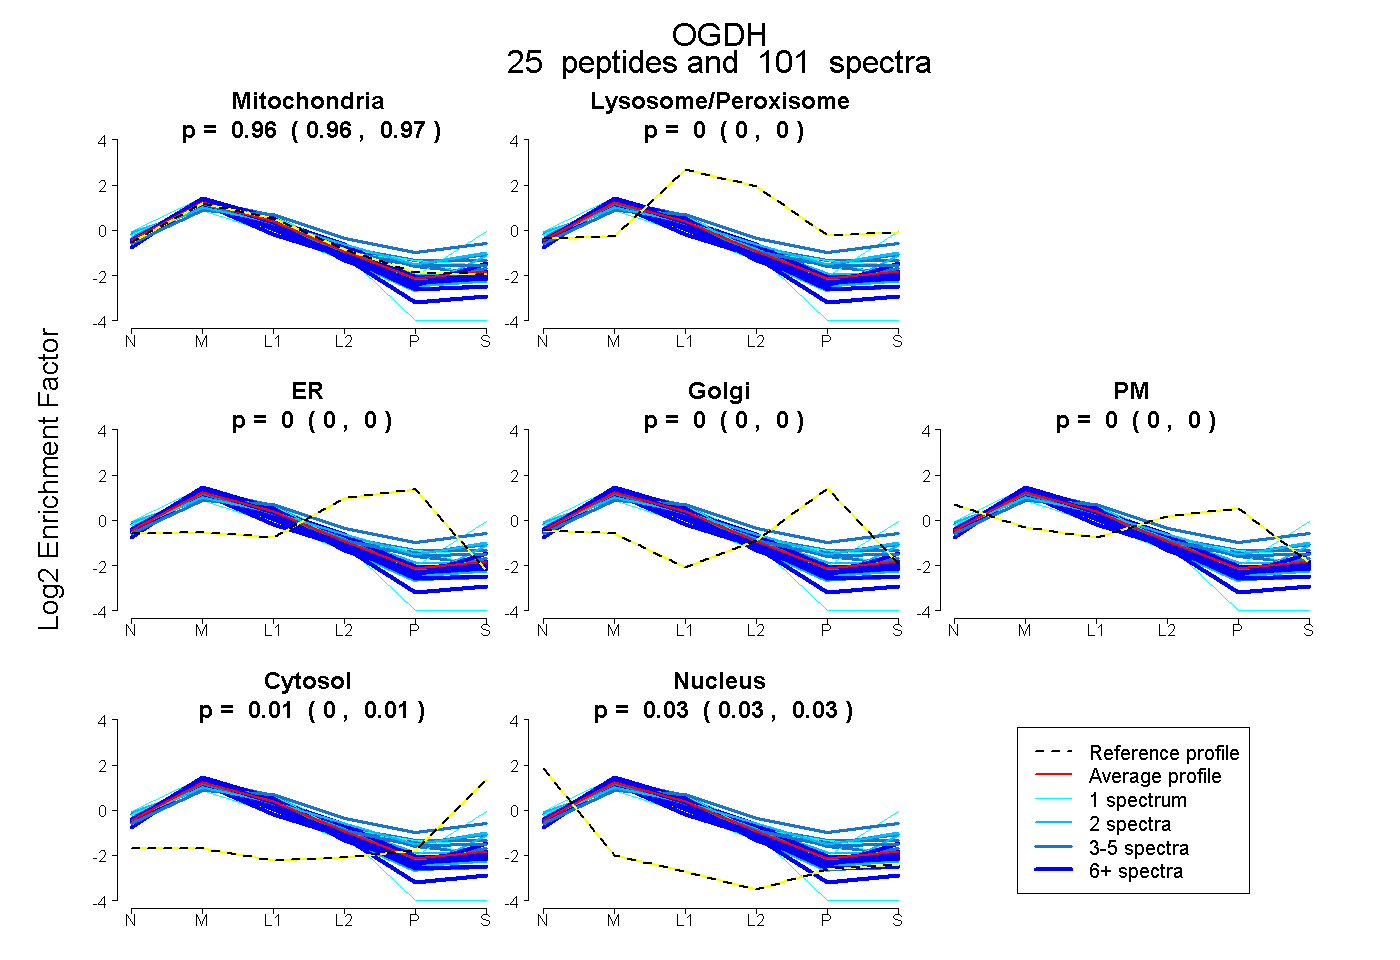
0.962 | 0.966
0.000 | 0.000
0.000 | 0.000
0.000 | 0.000
0.000 | 0.000
0.004 | 0.012
0.025 | 0.030
38peptides
spectra
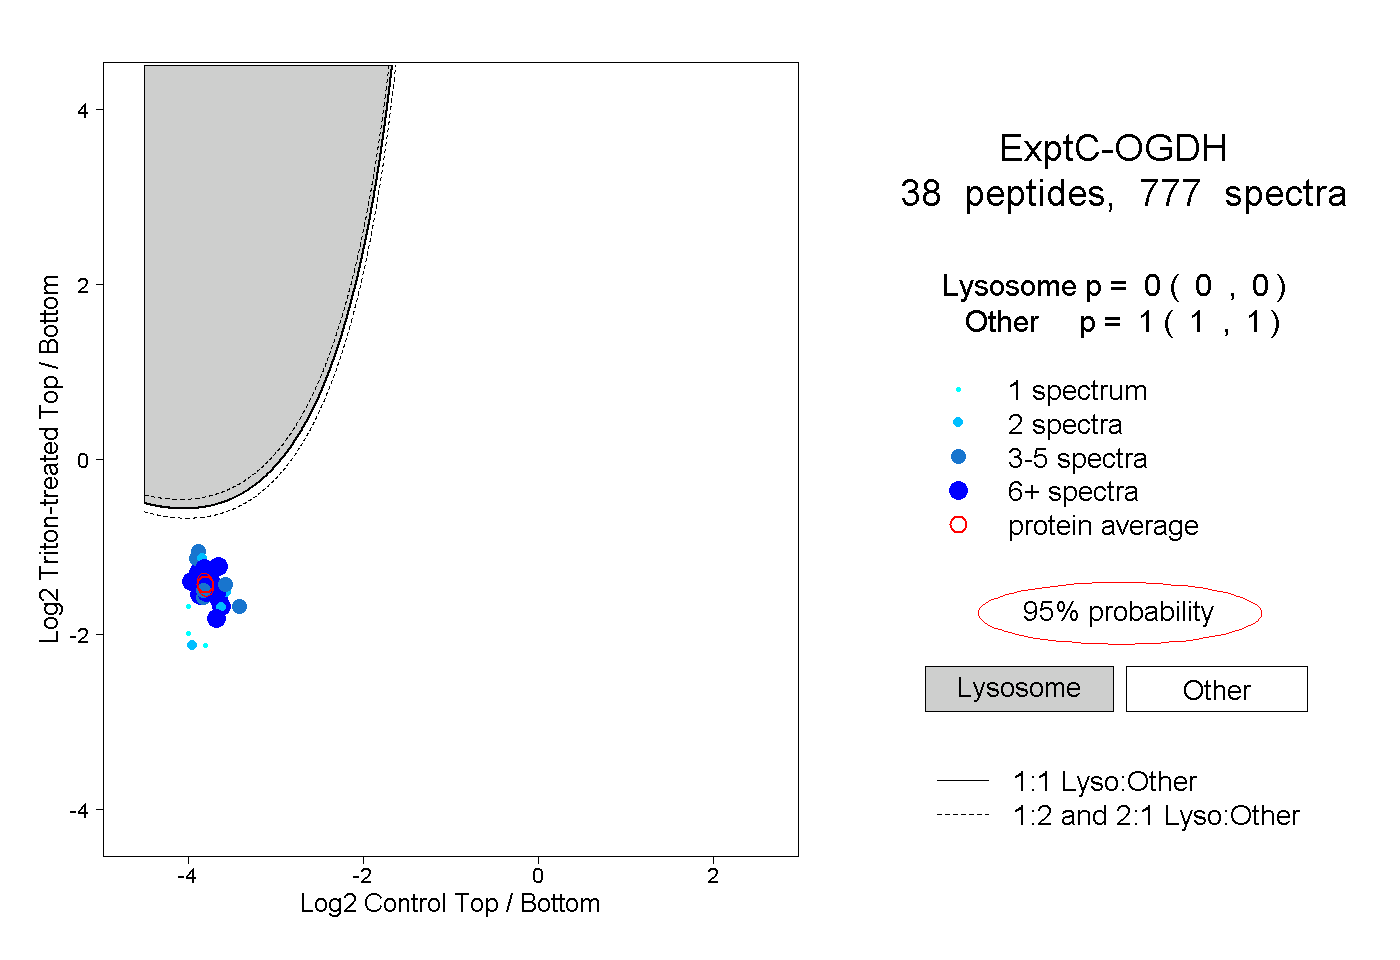
0.000 | 0.000
1.000 | 1.000
17peptides
spectra
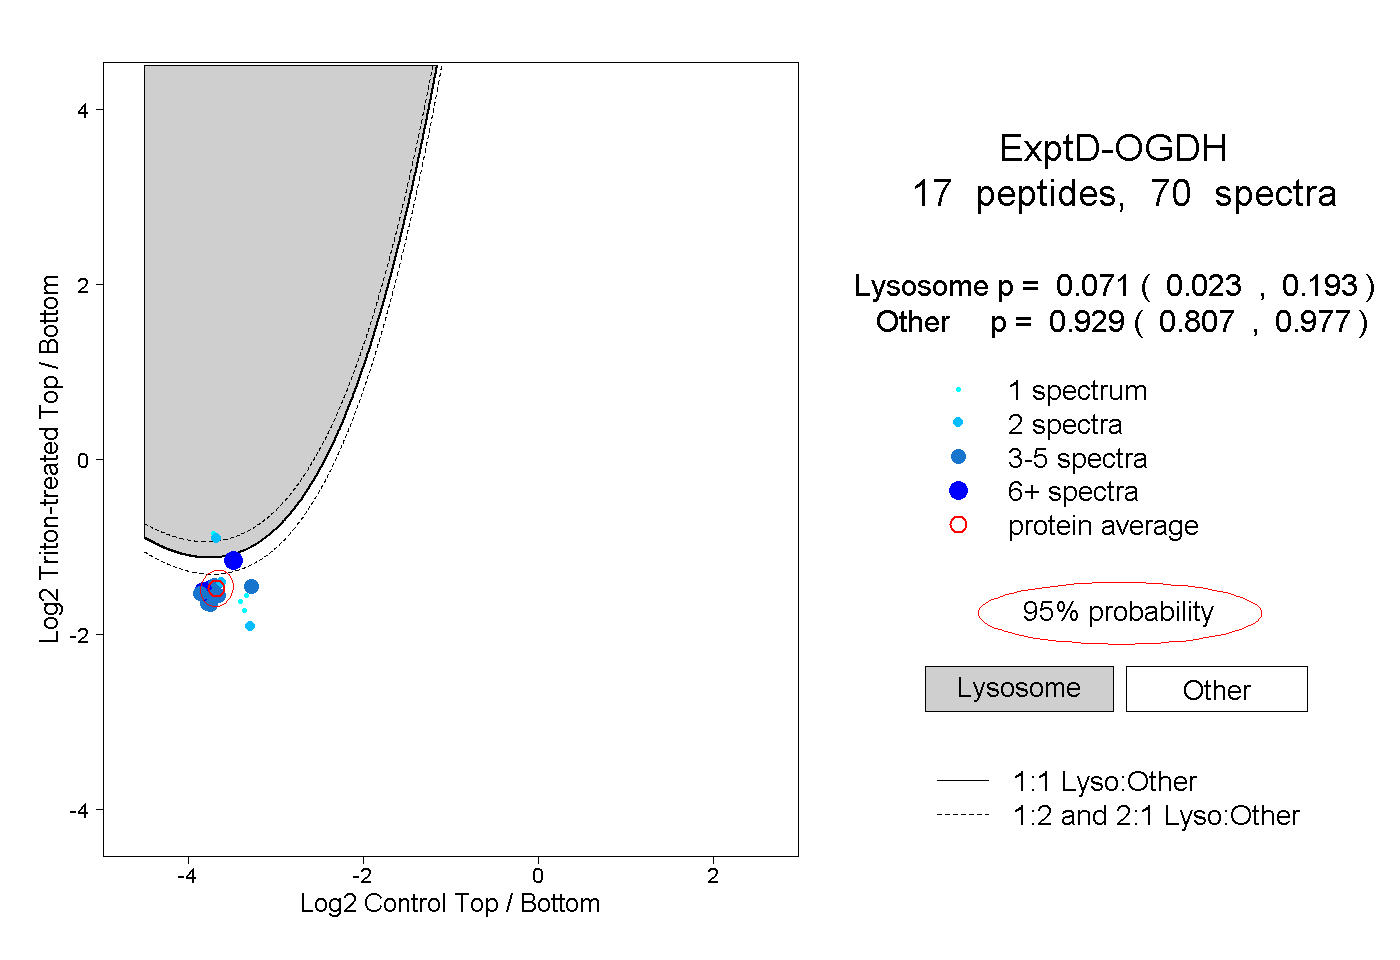
0.023 | 0.193
0.807 | 0.977