 4
4peptides
spectra
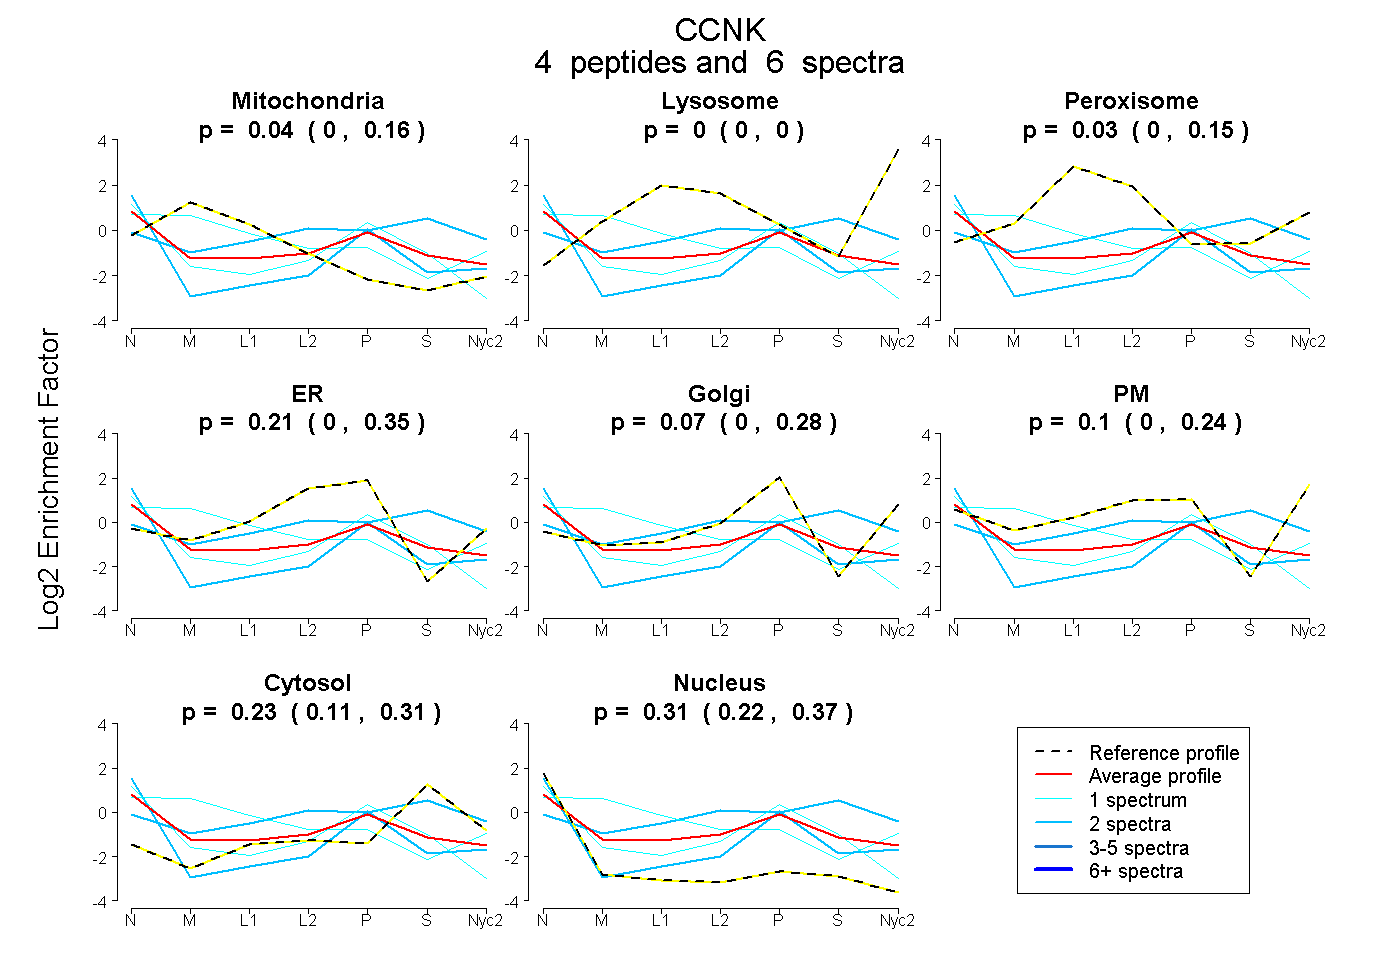
0.000 | 0.164
0.000 | 0.000
0.000 | 0.148
0.000 | 0.350
0.000 | 0.282
0.000 | 0.238
0.113 | 0.310
0.220 | 0.374
| Plot | Mito | Lyso | Perox | ER | Golgi | PM | Cytosol | Nucleus | |||||
| Expt A |
4 peptides |
6 spectra |
|
0.039 0.000 | 0.164 |
0.000 0.000 | 0.000 |
0.028 0.000 | 0.148 |
0.214 0.000 | 0.350 |
0.075 0.000 | 0.282 |
0.104 0.000 | 0.238 |
0.229 0.113 | 0.310 |
0.311 0.220 | 0.374 |
| 1 spectrum, FYMFHSFK | 0.000 | 0.000 | 0.000 | 0.351 | 0.000 | 0.000 | 0.184 | 0.465 | ||
| 2 spectra, ATEPPPPPK | 0.000 | 0.000 | 0.163 | 0.155 | 0.000 | 0.142 | 0.541 | 0.000 | ||
| 1 spectrum, DLAHTPSQLEGLDPATEAR | 0.541 | 0.000 | 0.000 | 0.000 | 0.006 | 0.350 | 0.010 | 0.093 | ||
| 2 spectra, FIFDVGTR | 0.000 | 0.000 | 0.000 | 0.000 | 0.382 | 0.000 | 0.066 | 0.552 |