ARFGAP2
[ENSRNOP00000053988]
Main page
| | | Plot |
Mito |
Lyso |
|
Perox |
ER |
Golgi |
PM |
Cytosol |
Nucleus |
|
| Expt A |
 17
17
peptides |
44
spectra |
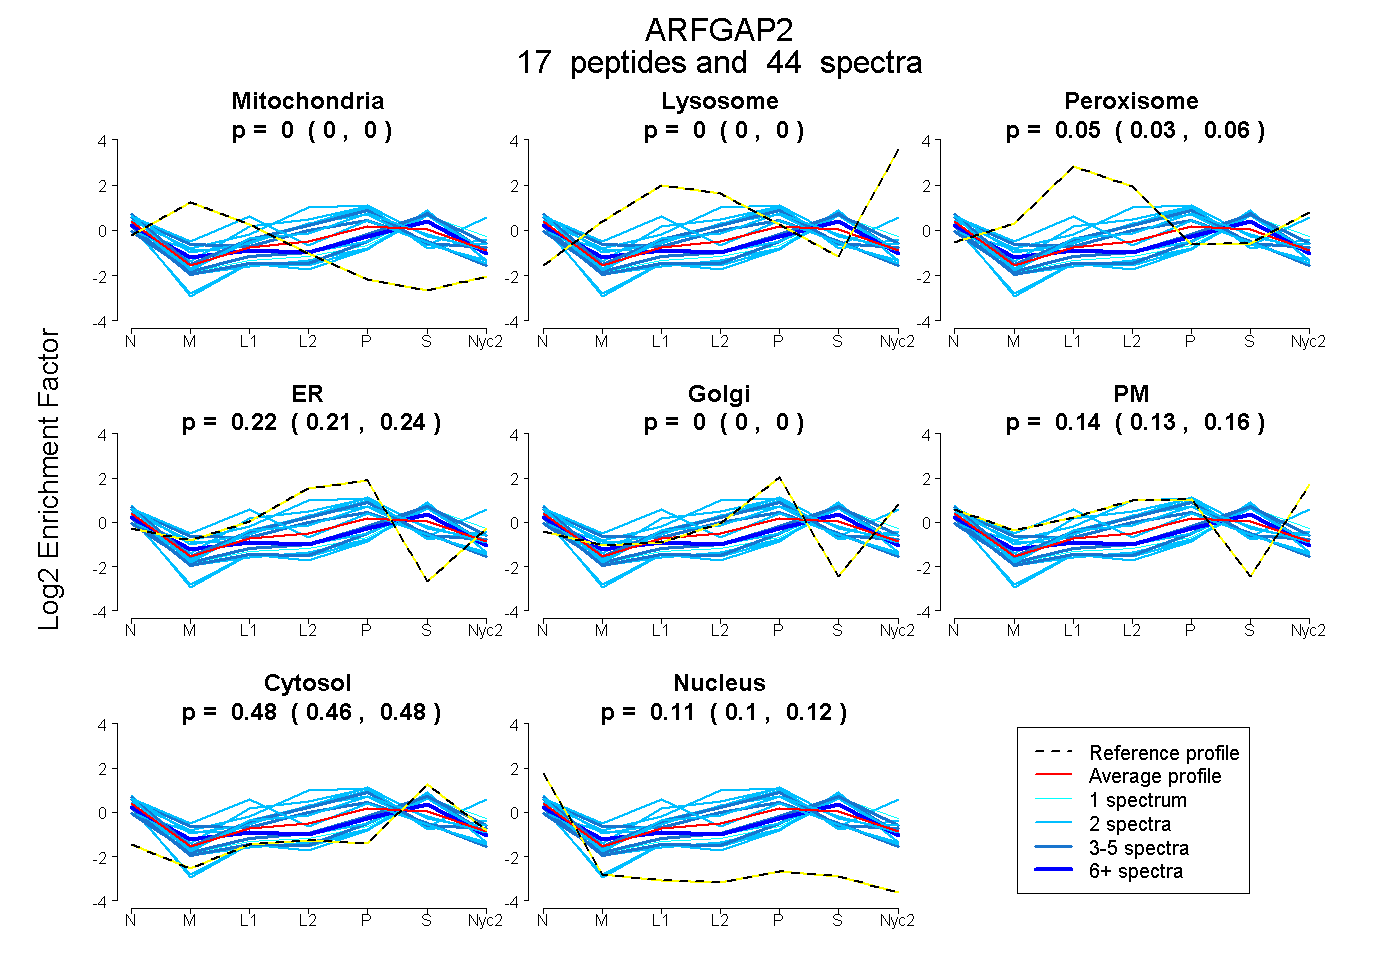 |
0.000
0.000 | 0.000 |
0.000
0.000 | 0.000 |
|
0.047
0.032 | 0.059 |
0.225
0.206 | 0.241 |
0.000
0.000 | 0.000 |
0.144
0.126 | 0.158 |
0.475
0.465 | 0.484 |
0.109
0.101 | 0.116 |
|
| | | Plot |
Mito |
|
Lyso or Perox |
|
ER |
Golgi |
PM |
Cytosol |
Nucleus |
|
| Expt B |
5
peptides |
12
spectra |
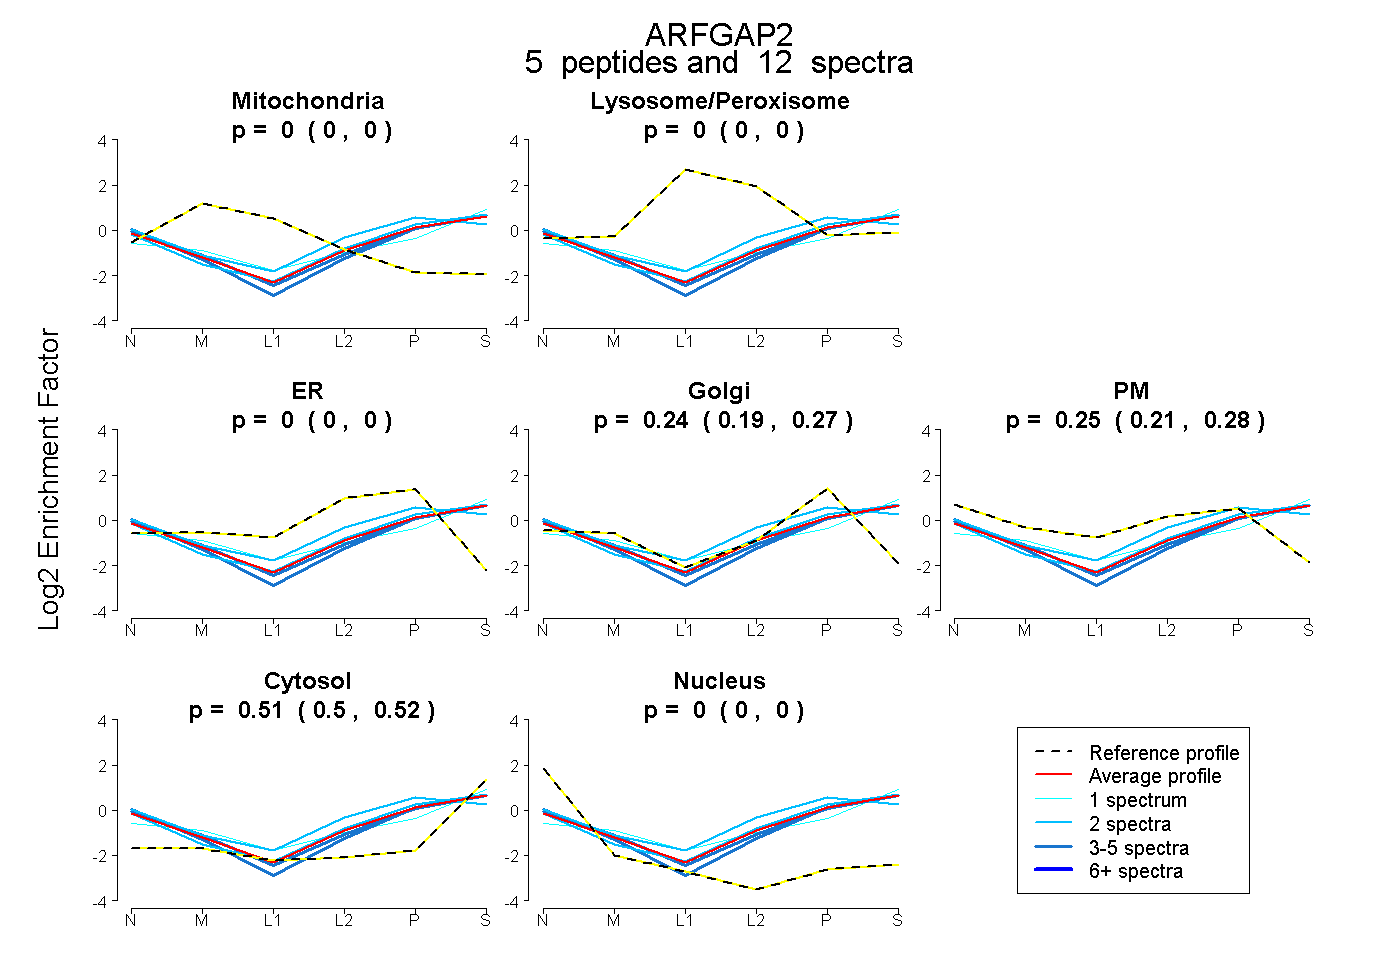 |
0.000
0.000 | 0.000 |
|
0.000
0.000 | 0.000 |
|
0.000
0.000 | 0.000 |
0.236
0.193 | 0.272 |
0.251
0.213 | 0.285 |
0.513
0.498 | 0.525 |
0.000
0.000 | 0.000 |
|
| 2 spectra, QLGSTALAR |
0.000 |
|
0.067 |
|
0.000 |
0.269 |
0.315 |
0.349 |
0.000 |
|
| 4 spectra, ISGLESSEAR |
0.000 |
|
0.000 |
|
0.000 |
0.268 |
0.213 |
0.519 |
0.000 |
|
| 3 spectra, EVDSEYEAR |
0.000 |
|
0.000 |
|
0.000 |
0.402 |
0.055 |
0.522 |
0.021 |
|
| 2 spectra, LAYQELQIDR |
0.000 |
|
0.000 |
|
0.000 |
0.243 |
0.239 |
0.519 |
0.000 |
|
| 1 spectrum, AISSDMFFGR |
0.000 |
|
0.077 |
|
0.000 |
0.104 |
0.217 |
0.602 |
0.000 |
|
| | | Plot |
|
Lyso |
|
|
|
|
|
|
|
Other |
| Expt C |
14
peptides |
48
spectra |
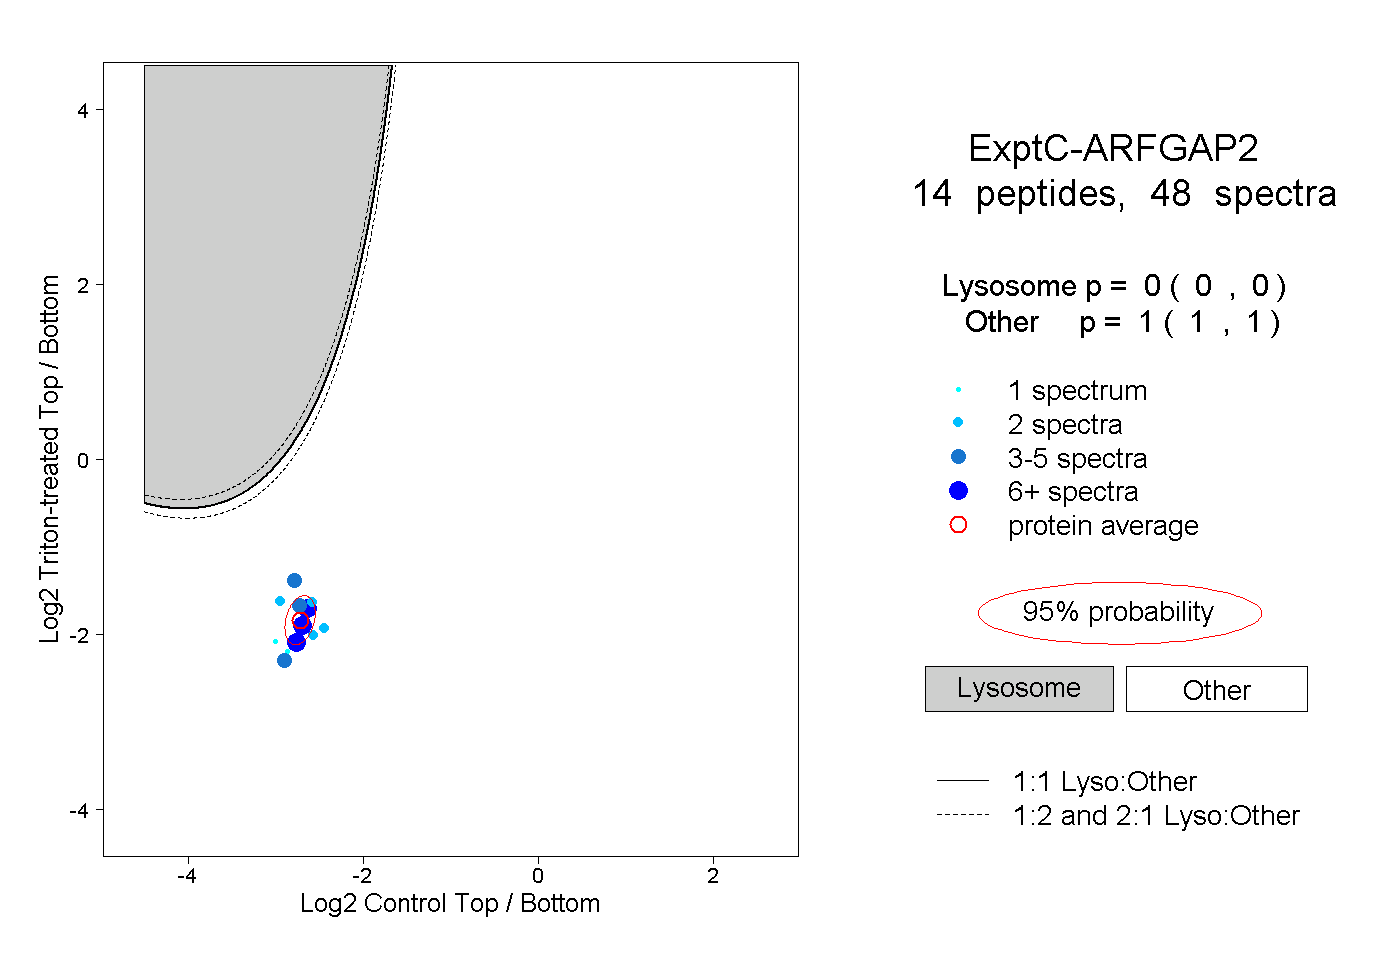 |
|
0.000
0.000 | 0.000 |
|
|
|
|
|
|
|
1.000
1.000 | 1.000 |
| | | Plot |
|
Lyso |
|
|
|
|
|
|
|
Other |
| Expt D |
5
peptides |
9
spectra |
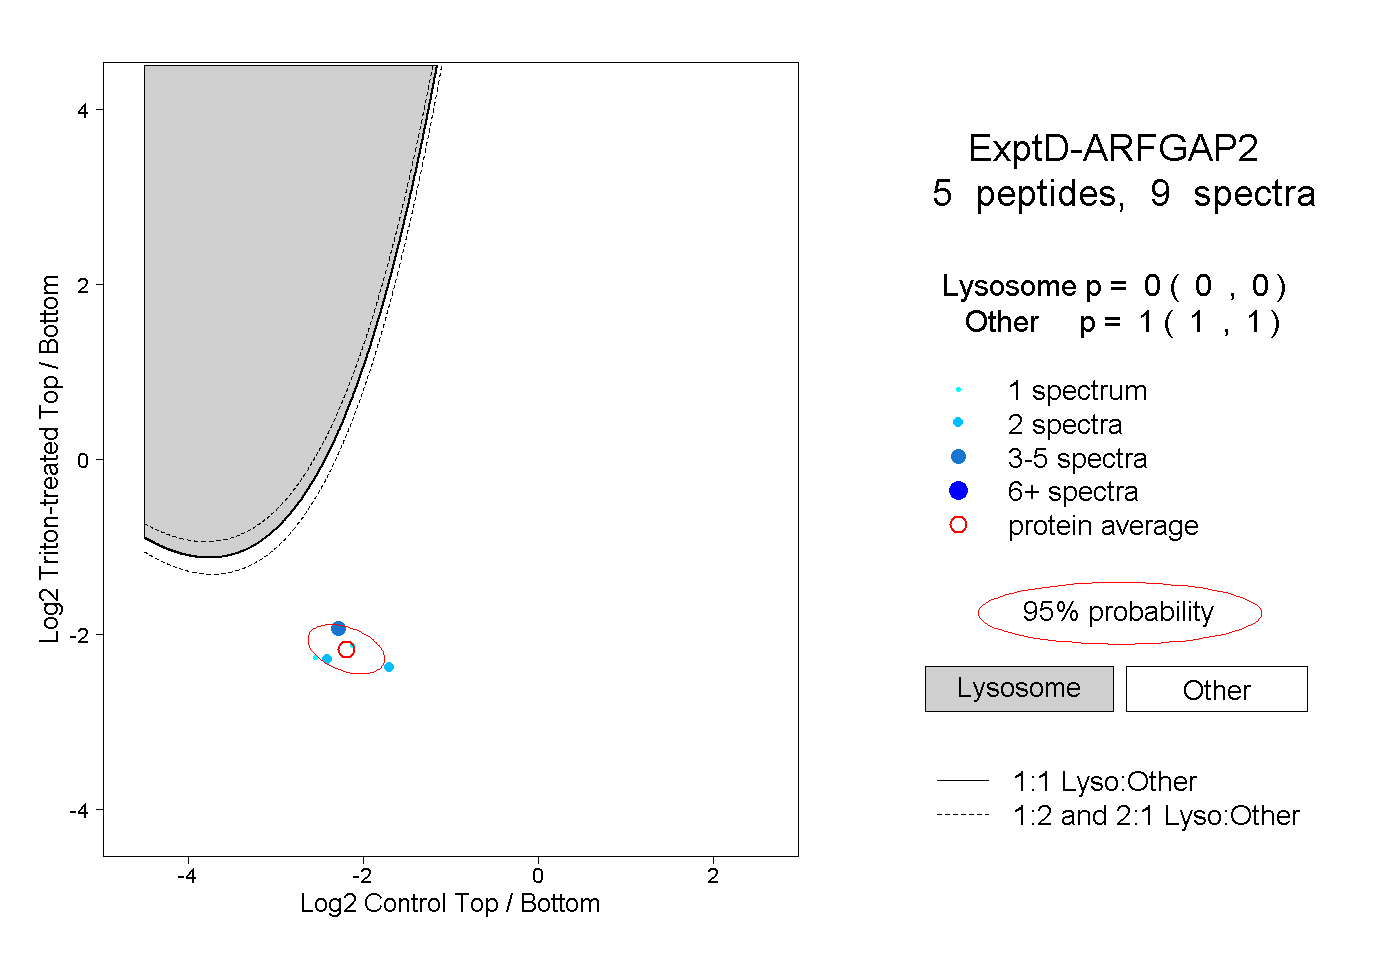 |
|
0.000
0.000 | 0.000 |
|
|
|
|
|
|
|
1.000
1.000 | 1.000 |