TBRG4
[ENSRNOP00000053972]
Main page
| | | Plot |
Mito |
Lyso |
|
Perox |
ER |
Golgi |
PM |
Cytosol |
Nucleus |
|
| Expt A |
 11
11
peptides |
25
spectra |
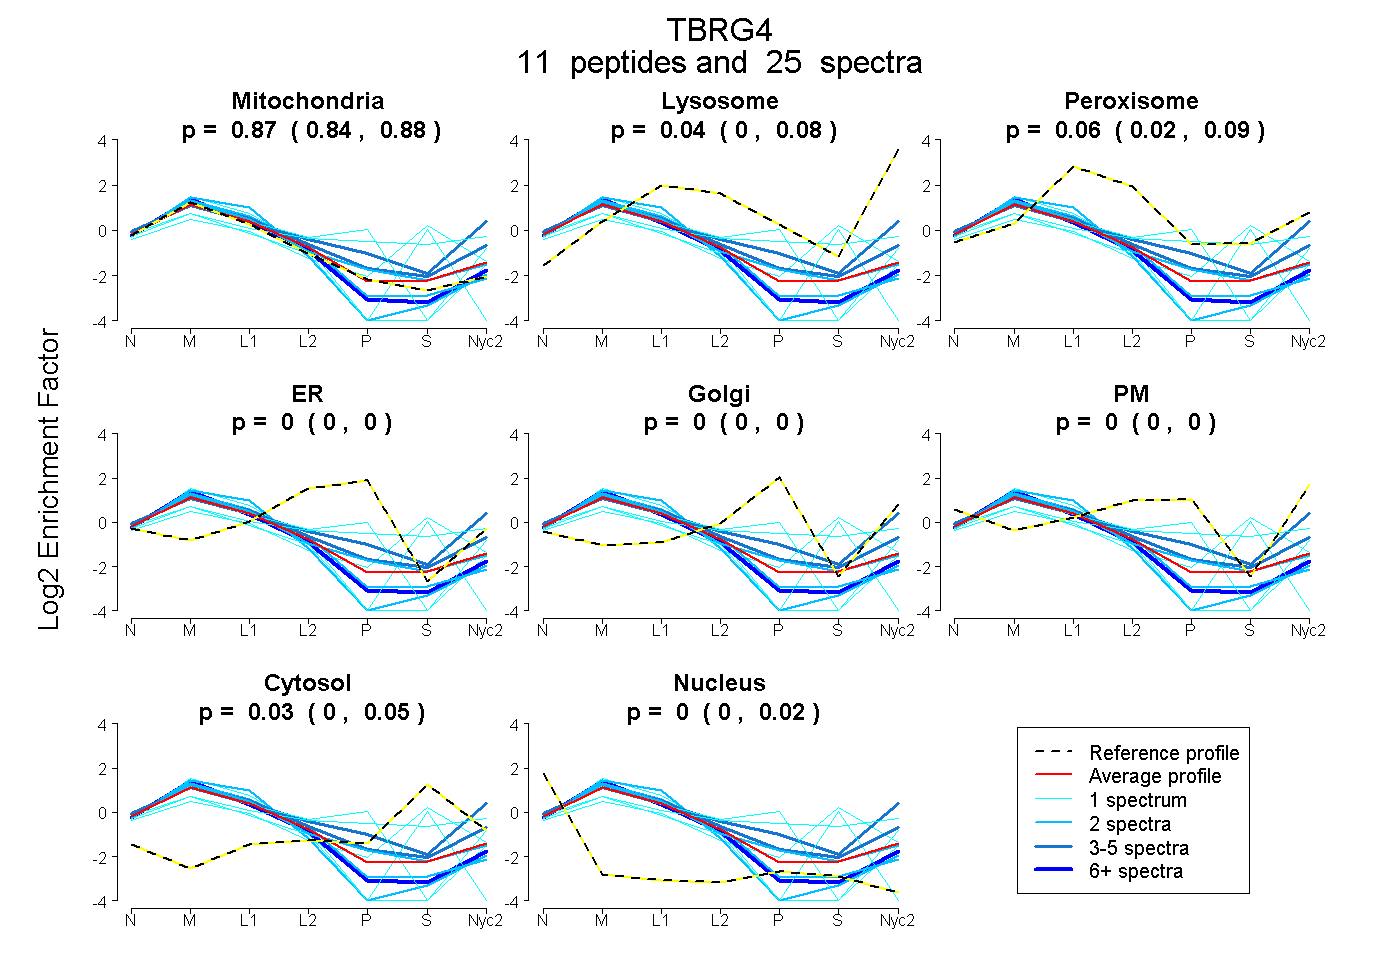 |
0.866
0.836 | 0.881 |
0.045
0.004 | 0.083 |
|
0.057
0.023 | 0.090 |
0.000
0.000 | 0.000 |
0.000
0.000 | 0.000 |
0.000
0.000 | 0.000 |
0.032
0.003 | 0.049 |
0.000
0.000 | 0.016 |
|
| | | Plot |
Mito |
|
Lyso or Perox |
|
ER |
Golgi |
PM |
Cytosol |
Nucleus |
|
| Expt B |
7
peptides |
14
spectra |
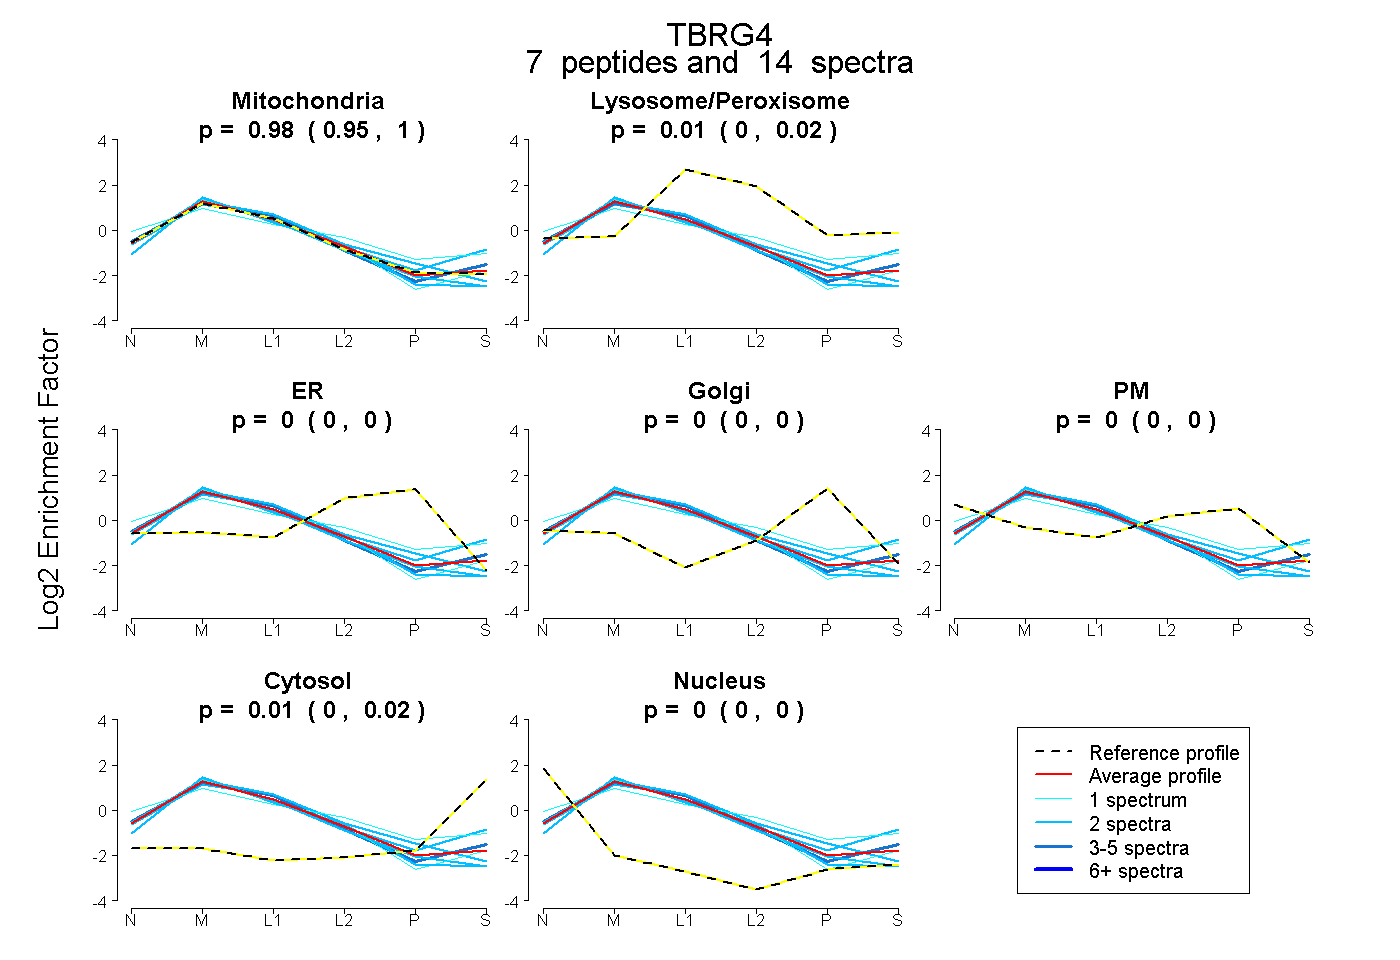 |
0.980
0.952 | 0.999 |
|
0.010
0.000 | 0.022 |
|
0.000
0.000 | 0.000 |
0.000
0.000 | 0.000 |
0.000
0.000 | 0.000 |
0.010
0.000 | 0.023 |
0.000
0.000 | 0.000 |
|
| 1 spectrum, SVPLLR |
0.987 |
|
0.000 |
|
0.000 |
0.000 |
0.000 |
0.013 |
0.000 |
|
| 2 spectra, FQQIVR |
0.919 |
|
0.010 |
|
0.071 |
0.000 |
0.000 |
0.000 |
0.000 |
|
| 2 spectra, SVEQEVR |
0.994 |
|
0.000 |
|
0.000 |
0.000 |
0.000 |
0.000 |
0.006 |
|
| 2 spectra, AVAEELAK |
0.758 |
|
0.124 |
|
0.000 |
0.000 |
0.000 |
0.118 |
0.000 |
|
| 4 spectra, ELLAELLR |
0.953 |
|
0.011 |
|
0.000 |
0.000 |
0.000 |
0.036 |
0.000 |
|
| 1 spectrum, SLYTLVLPQGSK |
0.626 |
|
0.131 |
|
0.000 |
0.000 |
0.166 |
0.077 |
0.000 |
|
| 2 spectra, VLMTLAAQSR |
1.000 |
|
0.000 |
|
0.000 |
0.000 |
0.000 |
0.000 |
0.000 |
|
| | | Plot |
|
Lyso |
|
|
|
|
|
|
|
Other |
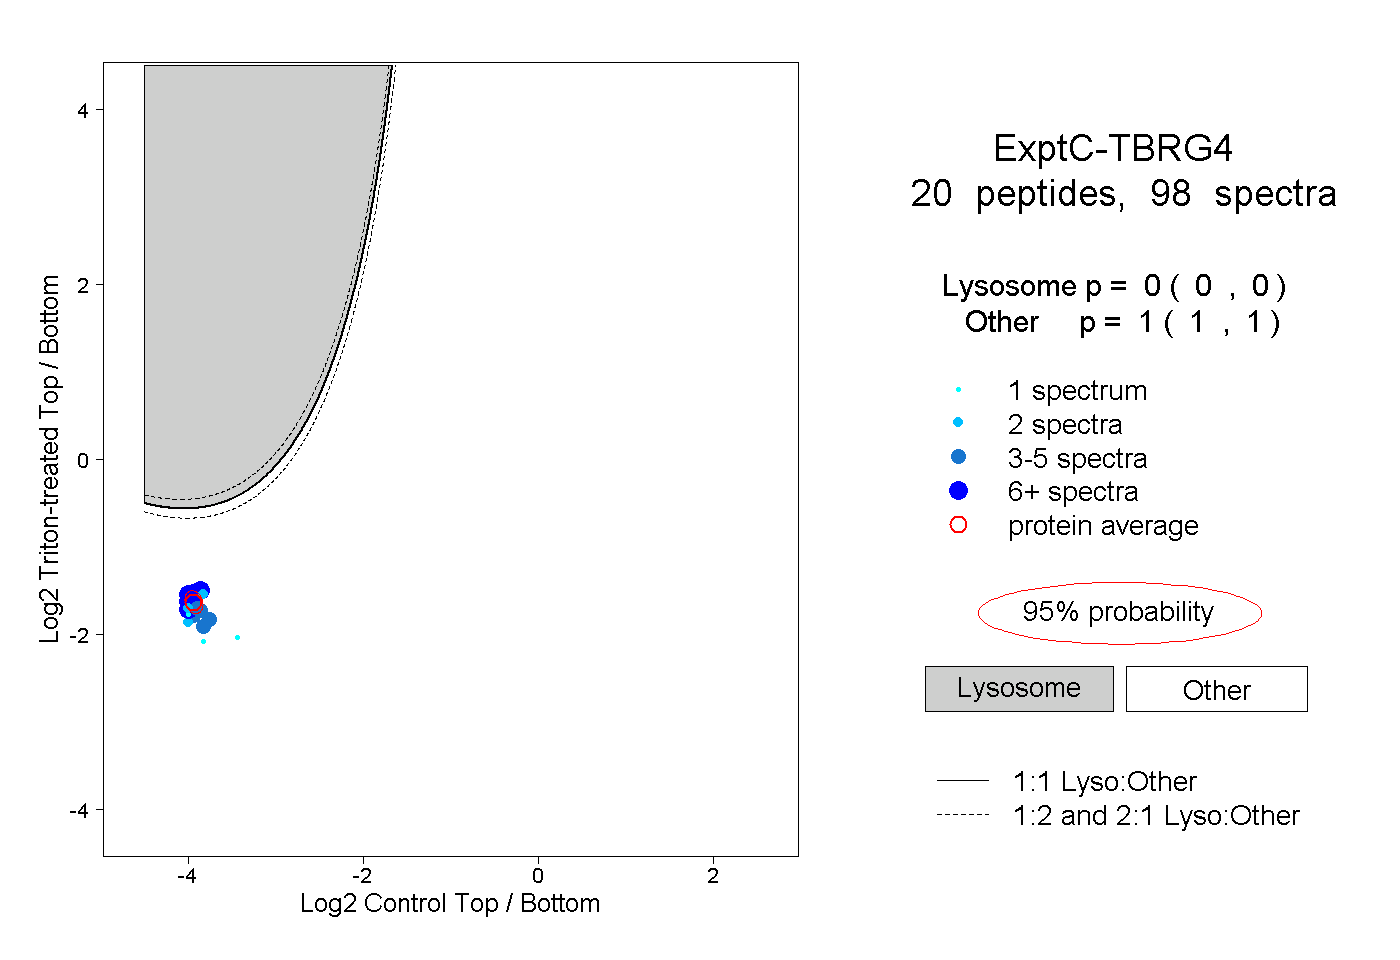
| Expt C |
20
peptides |
98
spectra |
 |
|
0.000
0.000 | 0.000 |
|
|
|
|
|
|
|
1.000
1.000 | 1.000 |
| | | Plot |
|
Lyso |
|
|
|
|
|
|
|
Other |
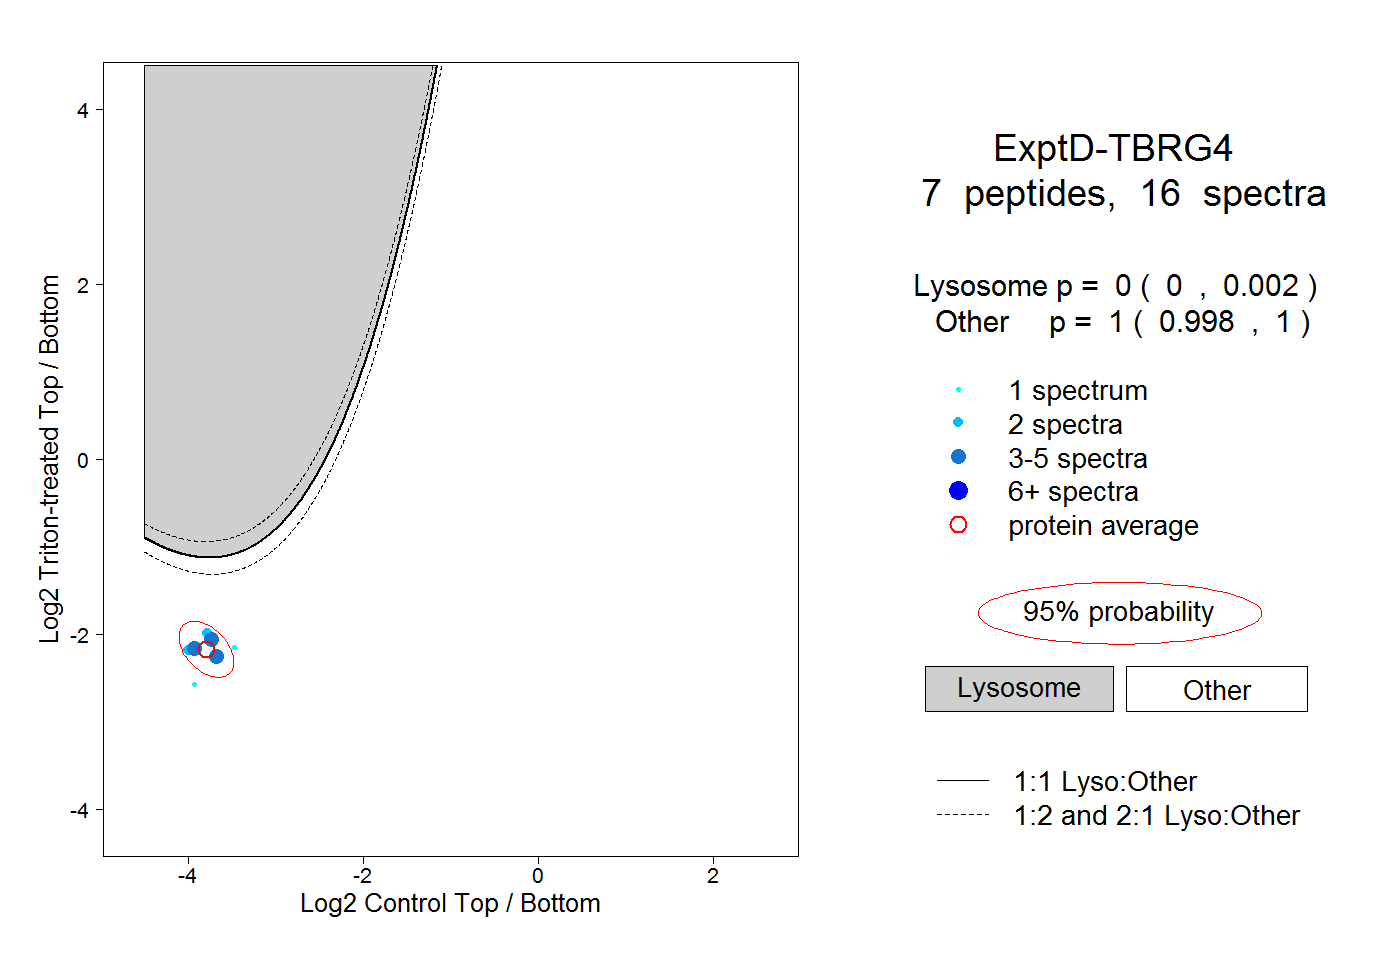
| Expt D |
7
peptides |
16
spectra |
 |
|
0.000
0.000 | 0.002 |
|
|
|
|
|
|
|
1.000
0.998 | 1.000 |