 11
11peptides
spectra
0.836 | 0.881
0.004 | 0.083
0.023 | 0.090
0.000 | 0.000
0.000 | 0.000
0.000 | 0.000
0.003 | 0.049
0.000 | 0.016
| Plot | Mito | Lyso | Perox | ER | Golgi | PM | Cytosol | Nucleus | |||||
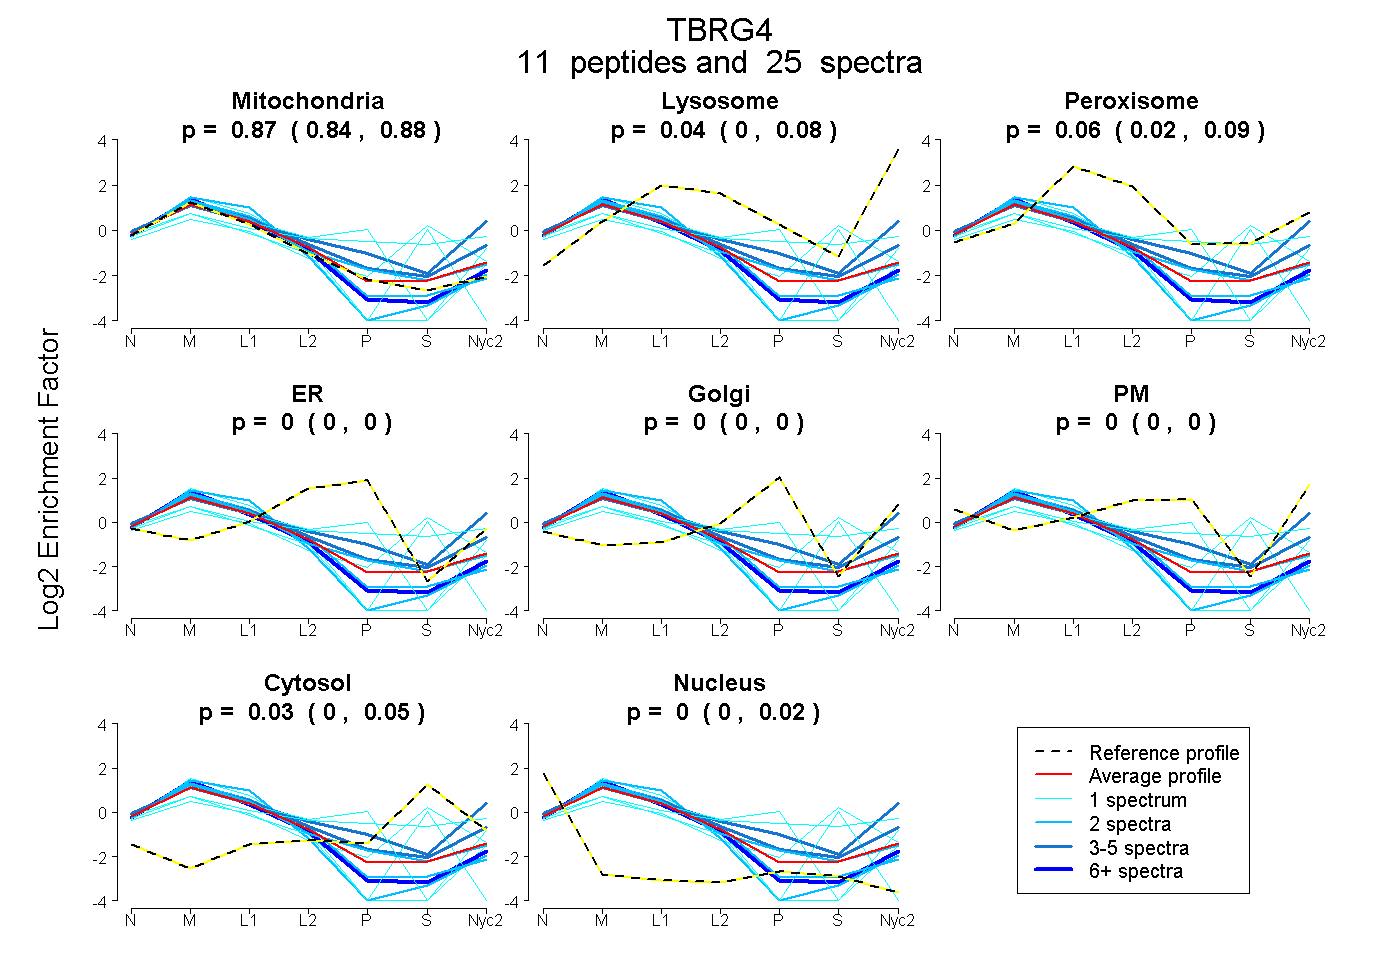
| Expt A |
11 peptides |
25 spectra |
|
0.866 0.836 | 0.881 |
0.045 0.004 | 0.083 |
0.057 0.023 | 0.090 |
0.000 0.000 | 0.000 |
0.000 0.000 | 0.000 |
0.000 0.000 | 0.000 |
0.032 0.003 | 0.049 |
0.000 0.000 | 0.016 |
| 2 spectra, LNFHPEQEDQFFNLVHEK | 1.000 | 0.000 | 0.000 | 0.000 | 0.000 | 0.000 | 0.000 | 0.000 | ||
| 3 spectra, FQQIVR | 0.551 | 0.240 | 0.000 | 0.000 | 0.000 | 0.193 | 0.016 | 0.000 | ||
| 3 spectra, SVEQEVR | 0.757 | 0.168 | 0.014 | 0.000 | 0.000 | 0.046 | 0.015 | 0.000 | ||
| 1 spectrum, AVAEELAK | 0.506 | 0.000 | 0.085 | 0.000 | 0.000 | 0.000 | 0.409 | 0.000 | ||
| 1 spectrum, GPFLPASAVAPSPSPSNK | 0.695 | 0.000 | 0.000 | 0.000 | 0.000 | 0.000 | 0.225 | 0.080 | ||
| 2 spectra, GMLLDLAYAYGK | 1.000 | 0.000 | 0.000 | 0.000 | 0.000 | 0.000 | 0.000 | 0.000 | ||
| 1 spectrum, DFVAPHLAQPVGNQPLPPGAK | 1.000 | 0.000 | 0.000 | 0.000 | 0.000 | 0.000 | 0.000 | 0.000 | ||
| 8 spectra, ELLAELLR | 1.000 | 0.000 | 0.000 | 0.000 | 0.000 | 0.000 | 0.000 | 0.000 | ||
| 2 spectra, WEFPNFNSR | 0.868 | 0.054 | 0.045 | 0.000 | 0.022 | 0.000 | 0.011 | 0.000 | ||
| 1 spectrum, VLMTLAAQSR | 0.558 | 0.000 | 0.000 | 0.258 | 0.022 | 0.162 | 0.000 | 0.000 | ||
| 1 spectrum, WTEISDSR | 0.372 | 0.060 | 0.144 | 0.000 | 0.051 | 0.156 | 0.218 | 0.000 |
| Plot | Mito | Lyso or Perox | ER | Golgi | PM | Cytosol | Nucleus | ||||||
| Expt B |
7 peptides |
14 spectra |
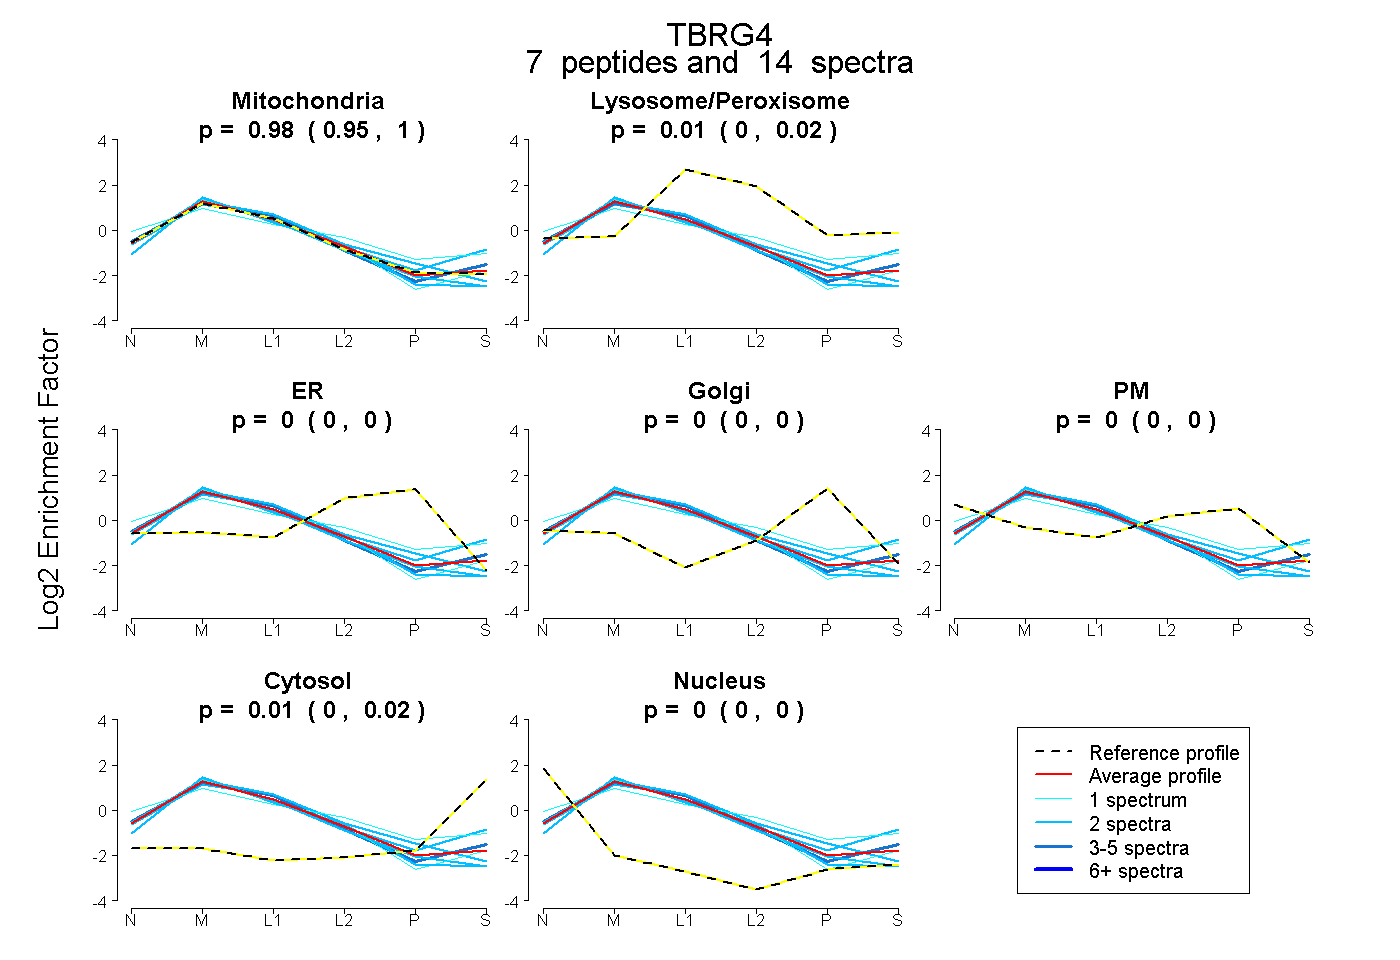 |
0.980 0.952 | 0.999 |
0.010 0.000 | 0.022 |
0.000 0.000 | 0.000 |
0.000 0.000 | 0.000 |
0.000 0.000 | 0.000 |
0.010 0.000 | 0.023 |
0.000 0.000 | 0.000 |
|||
| Plot | Lyso | Other | |||||||||||
| Expt C |
20 peptides |
98 spectra |
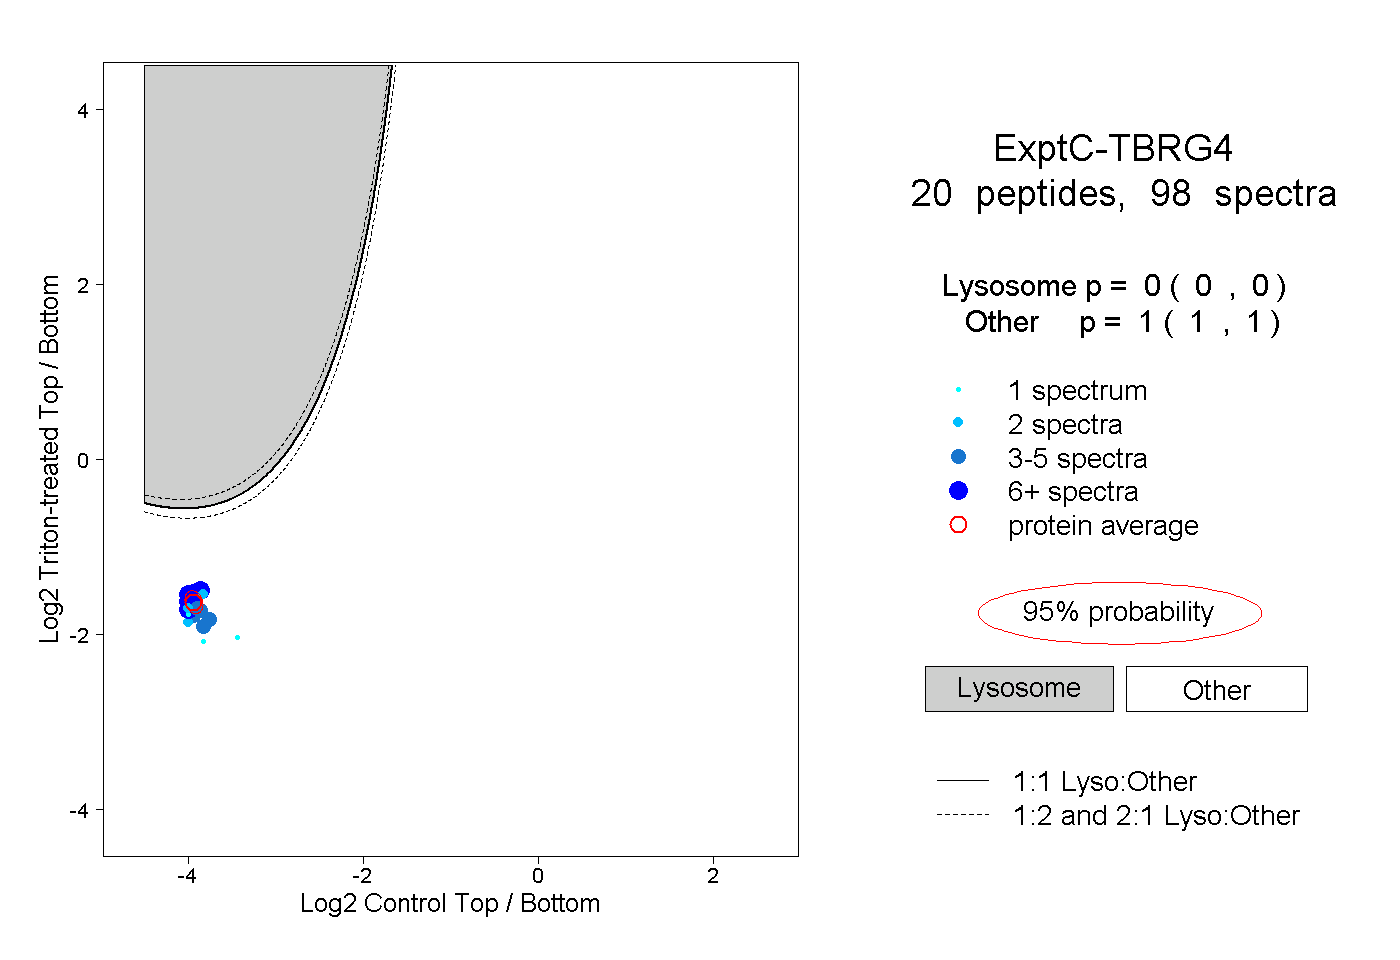 |
0.000 0.000 | 0.000 |
1.000 1.000 | 1.000 |
||||||||
| Plot | Lyso | Other | |||||||||||
| Expt D |
7 peptides |
16 spectra |
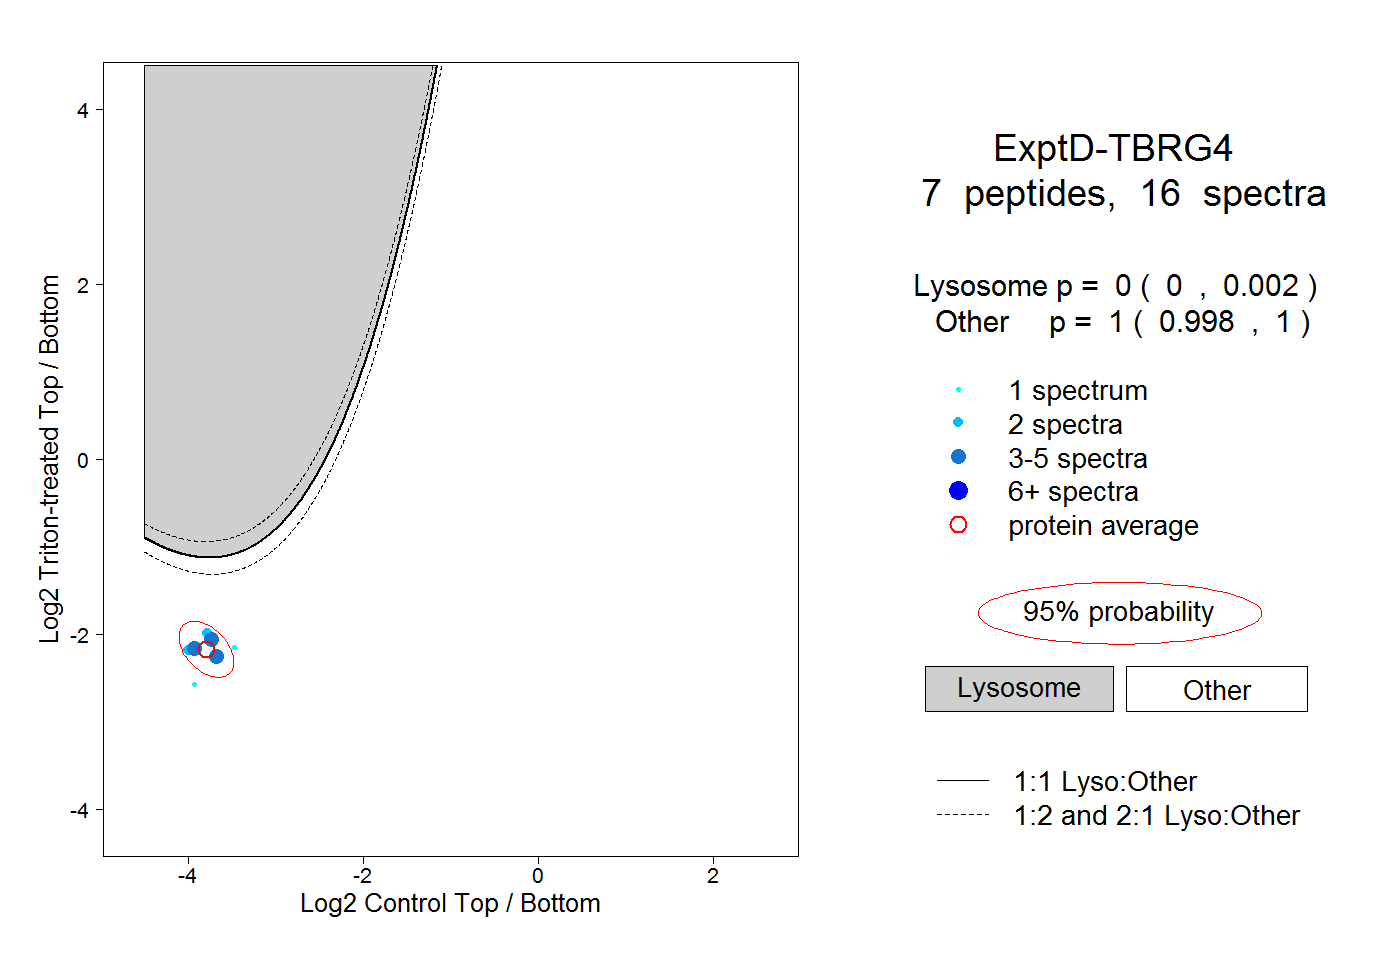 |
0.000 0.000 | 0.002 |
1.000 0.998 | 1.000 |