 2
2peptides
spectra
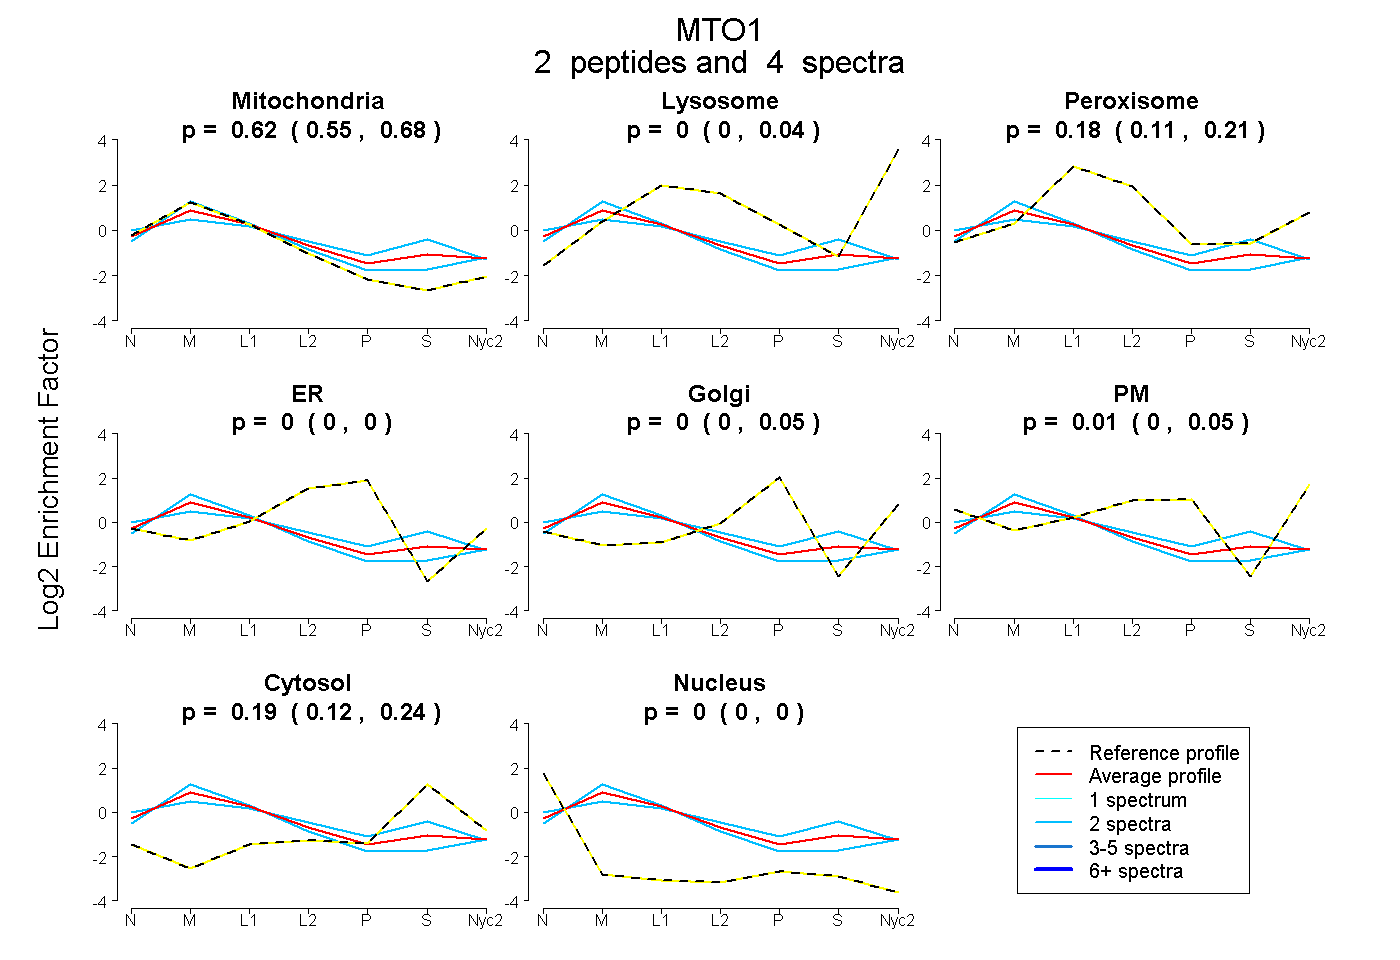
0.545 | 0.679
0.000 | 0.035
0.106 | 0.206
0.000 | 0.000
0.000 | 0.054
0.000 | 0.053
0.116 | 0.245
0.000 | 0.000
2peptides
spectra
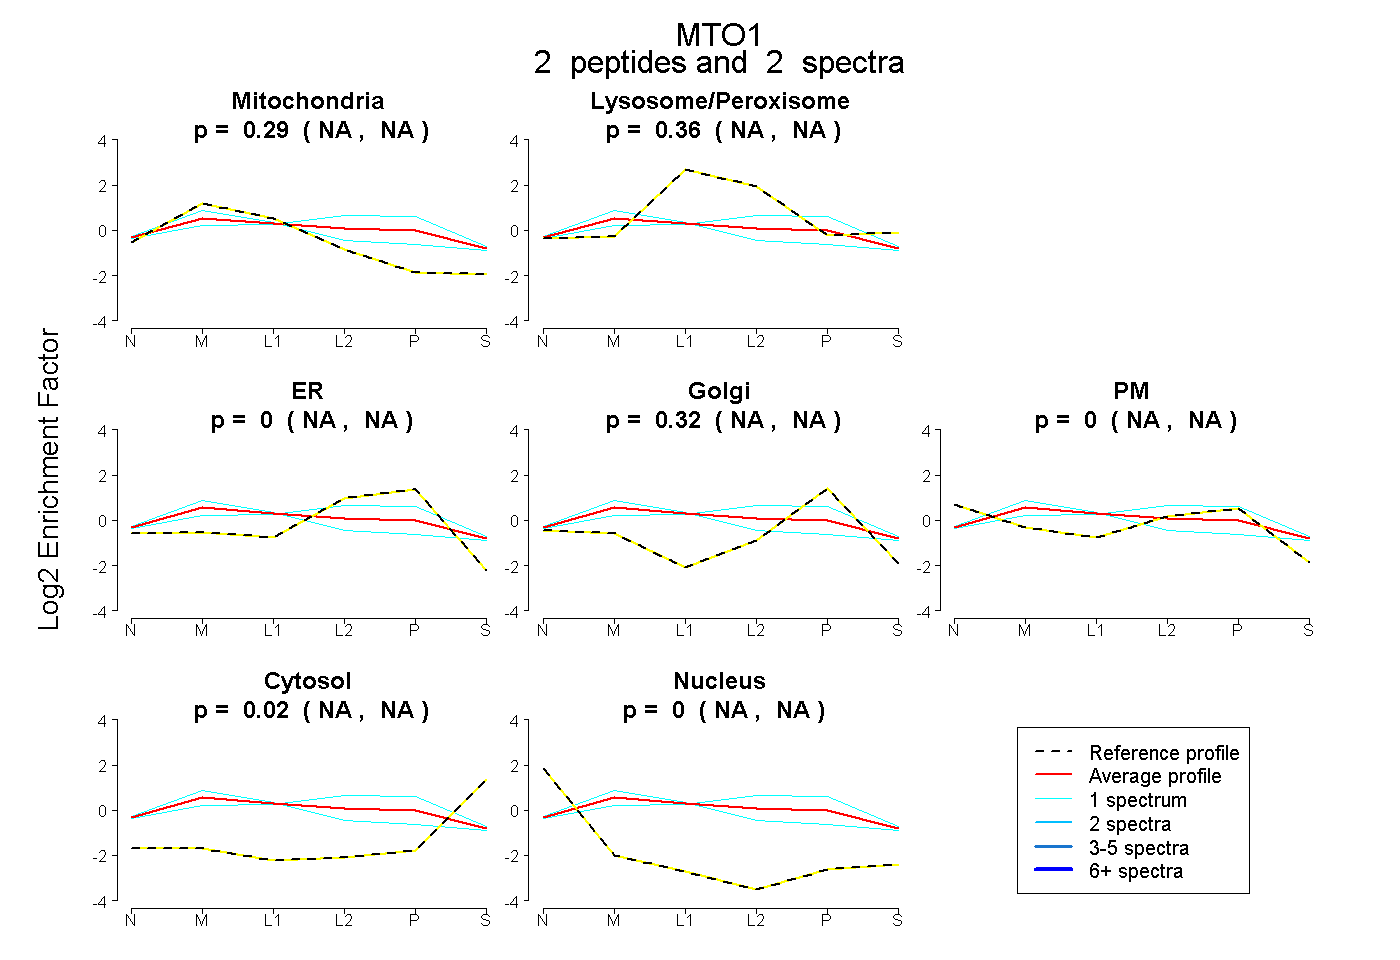
NA | NA
NA | NA
NA | NA
NA | NA
NA | NA
NA | NA
NA | NA
2peptides
spectra
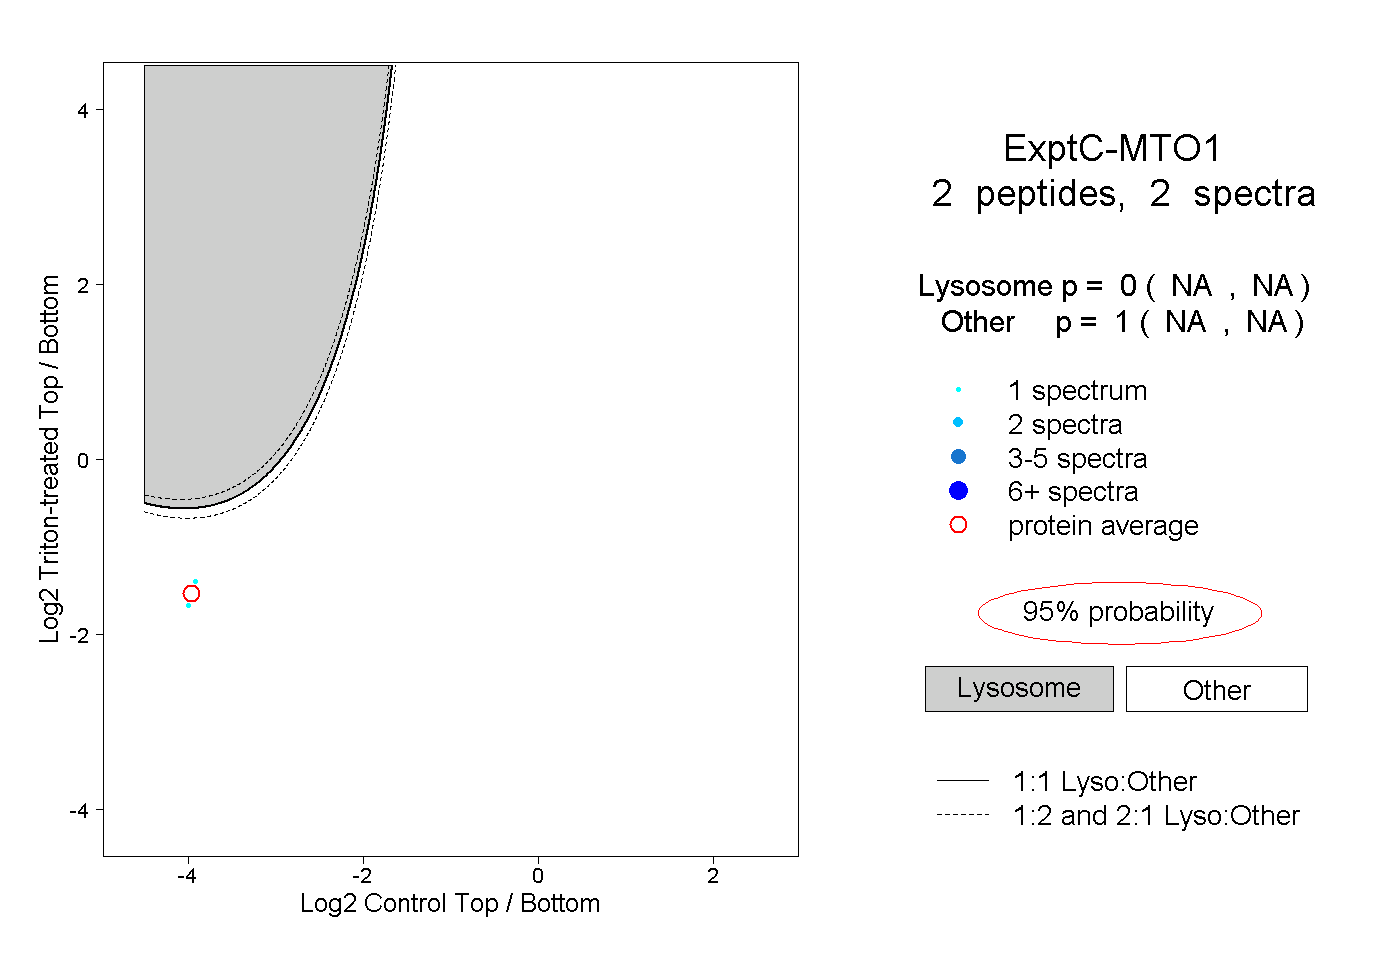
NA | NA
NA | NA
1peptide
spectrum
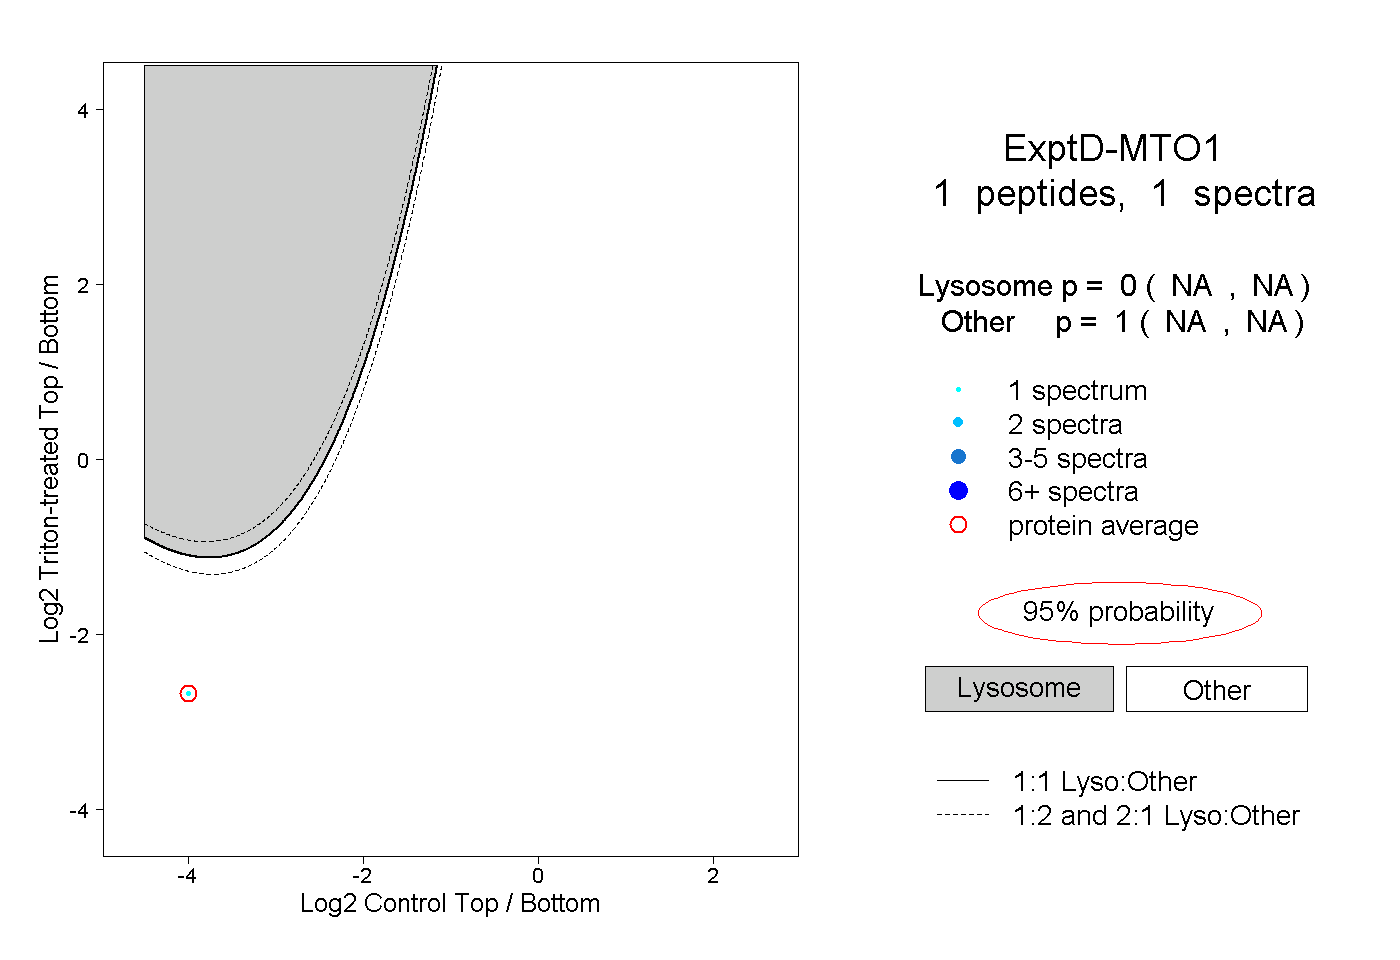
NA | NA
NA | NA