 3
3peptides
spectra
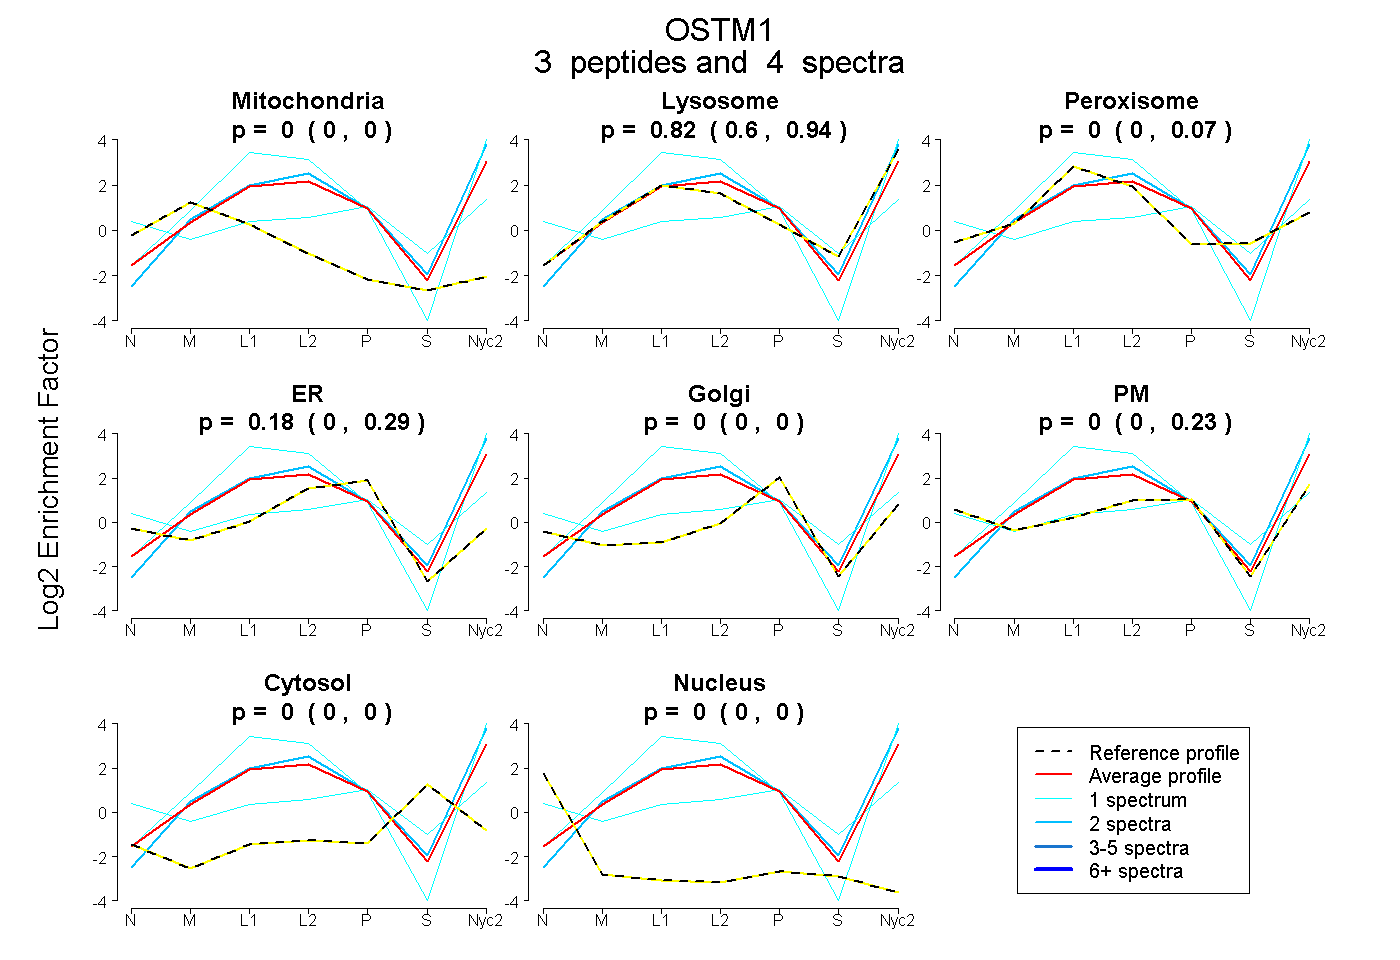
0.000 | 0.000
0.601 | 0.940
0.000 | 0.072
0.000 | 0.290
0.000 | 0.000
0.000 | 0.232
0.000 | 0.000
0.000 | 0.000
2peptides
spectra
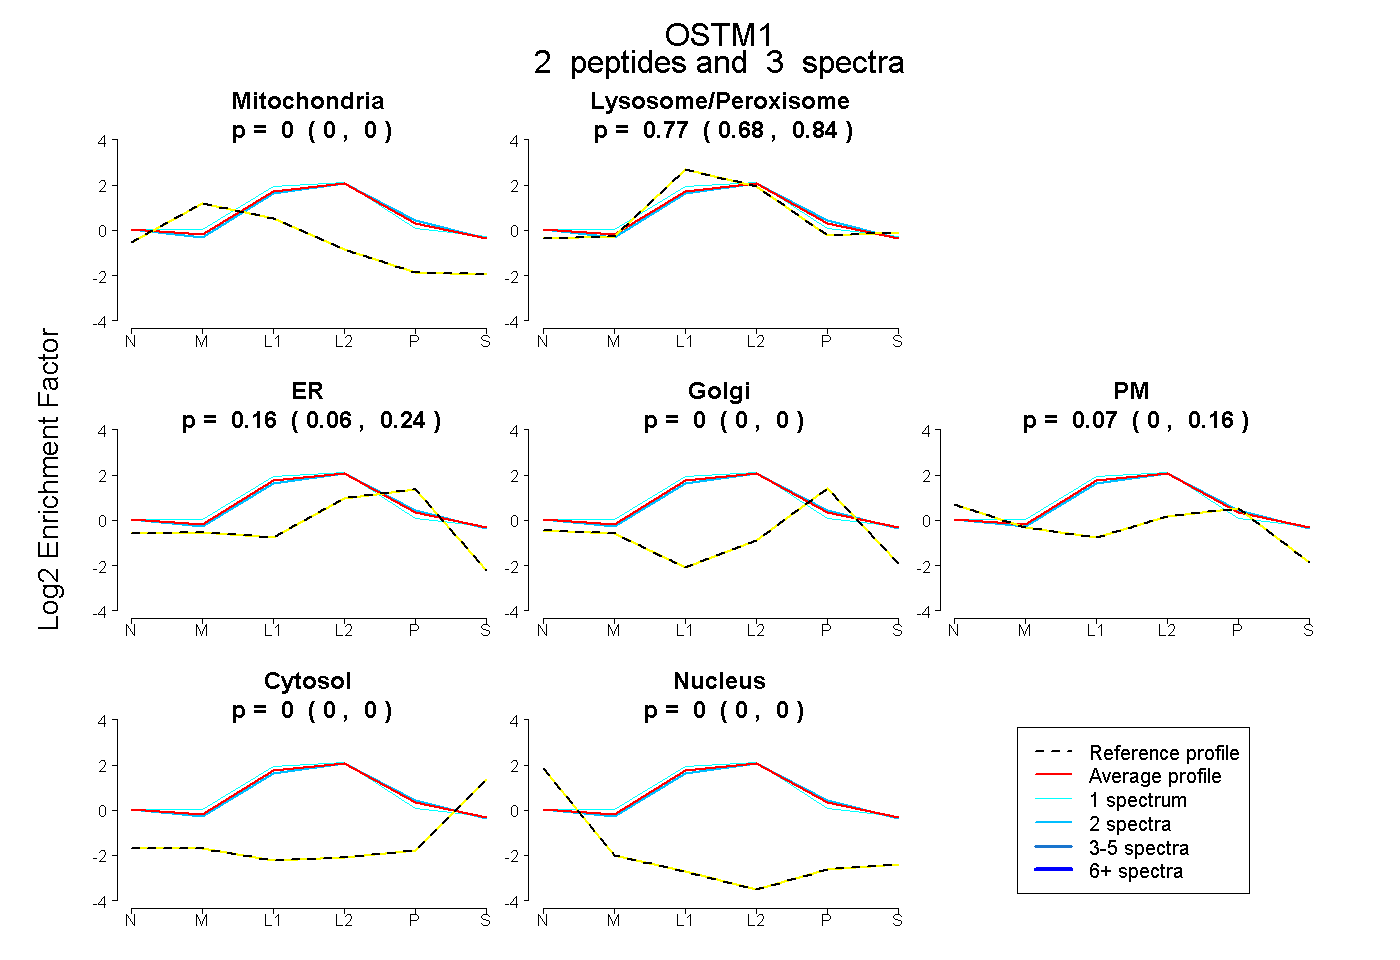
0.000 | 0.000
0.681 | 0.844
0.055 | 0.238
0.000 | 0.000
0.000 | 0.164
0.000 | 0.000
0.000 | 0.000
6peptides
spectra
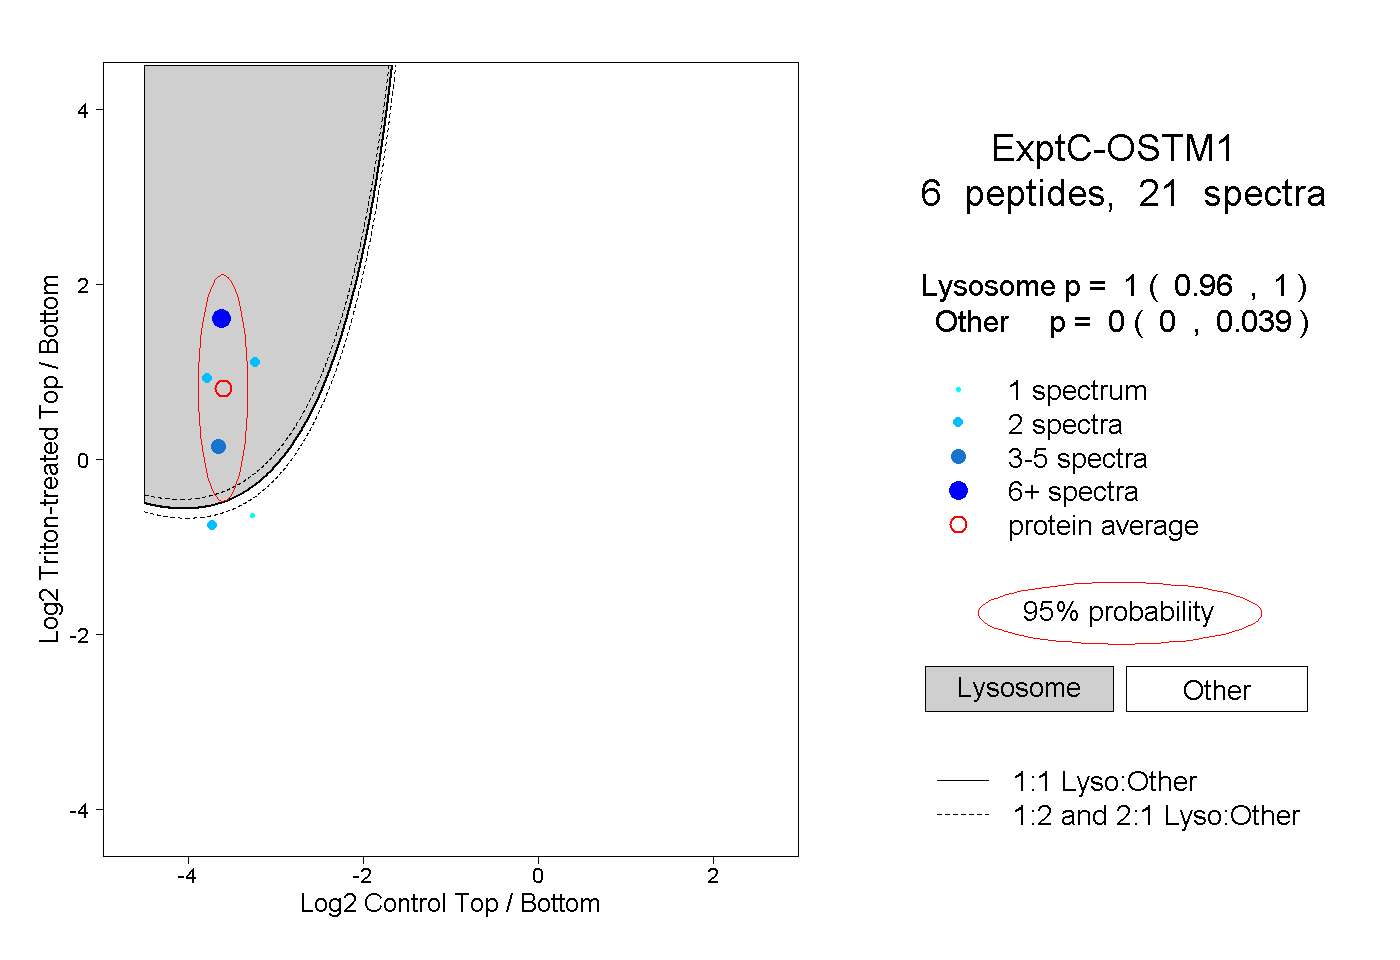
0.960 | 1.000
0.000 | 0.039