 8
8peptides
spectra
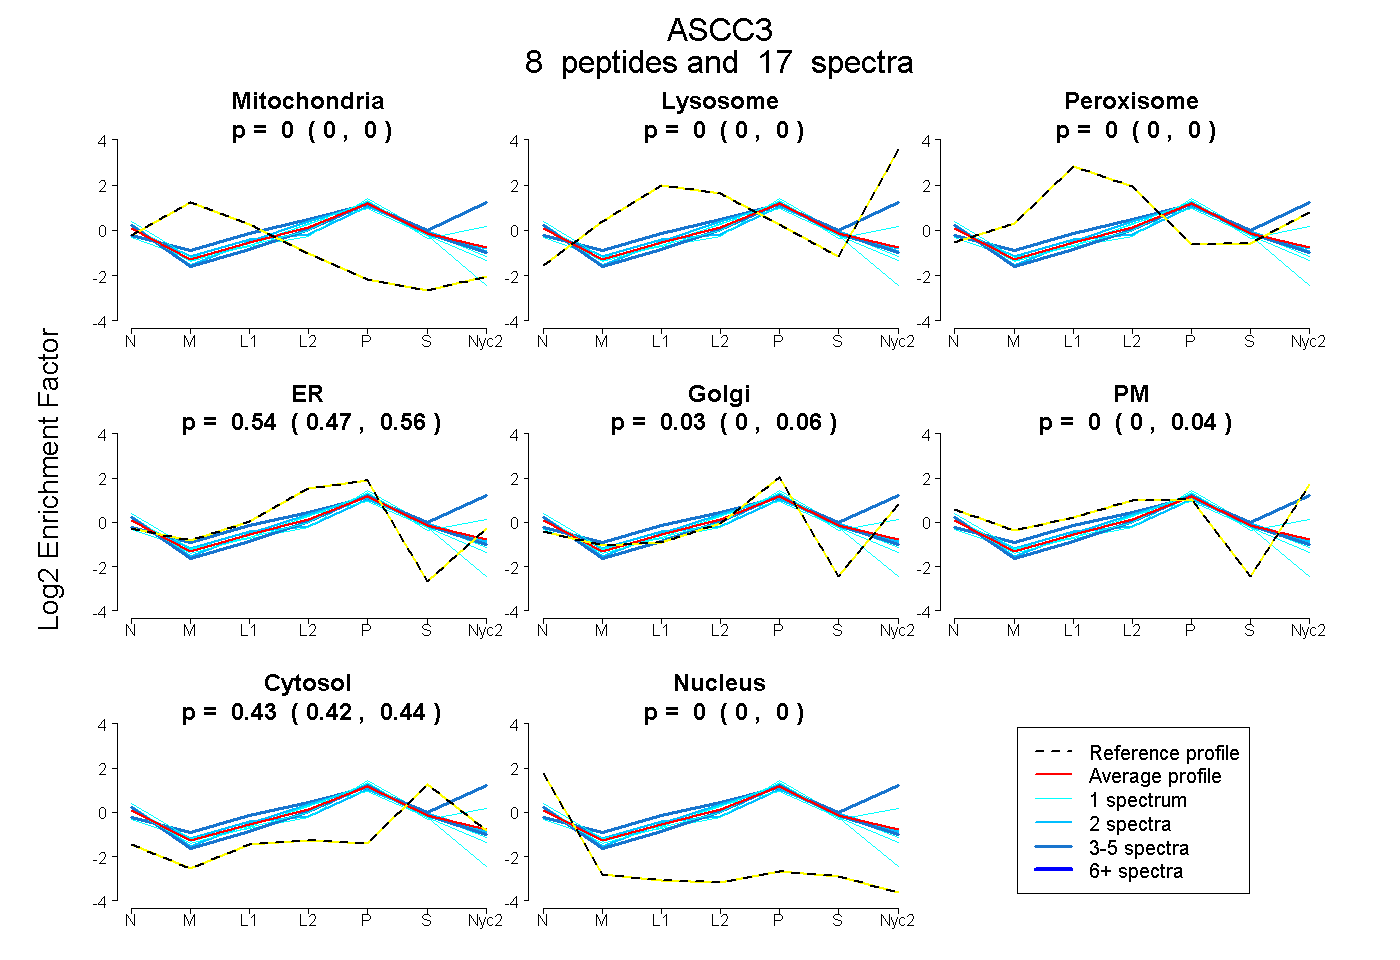
0.000 | 0.000
0.000 | 0.000
0.000 | 0.000
0.469 | 0.564
0.000 | 0.057
0.000 | 0.043
0.422 | 0.440
0.000 | 0.000
| Plot | Mito | Lyso | Perox | ER | Golgi | PM | Cytosol | Nucleus | |||||
| Expt A |
8 peptides |
17 spectra |
|
0.000 0.000 | 0.000 |
0.000 0.000 | 0.000 |
0.000 0.000 | 0.000 |
0.541 0.469 | 0.564 |
0.026 0.000 | 0.057 |
0.000 0.000 | 0.043 |
0.433 0.422 | 0.440 |
0.000 0.000 | 0.000 |
| 1 spectrum, SHSPAKPVLIFVSSR | 0.000 | 0.000 | 0.000 | 0.242 | 0.157 | 0.255 | 0.346 | 0.000 | ||
| 2 spectra, AHLLLQAHLSR | 0.000 | 0.000 | 0.032 | 0.458 | 0.053 | 0.000 | 0.444 | 0.012 | ||
| 1 spectrum, TSIECLPELIHACEGK | 0.000 | 0.000 | 0.000 | 0.536 | 0.000 | 0.000 | 0.331 | 0.134 | ||
| 1 spectrum, YVDFPITDVLQMMGR | 0.000 | 0.000 | 0.000 | 0.553 | 0.000 | 0.000 | 0.404 | 0.043 | ||
| 5 spectra, DENTWIK | 0.000 | 0.206 | 0.037 | 0.000 | 0.235 | 0.225 | 0.297 | 0.000 | ||
| 4 spectra, VHFEFHK | 0.000 | 0.000 | 0.000 | 0.500 | 0.038 | 0.000 | 0.432 | 0.030 | ||
| 1 spectrum, AVILVHDIK | 0.000 | 0.000 | 0.000 | 0.454 | 0.092 | 0.000 | 0.454 | 0.000 | ||
| 2 spectra, HNEDHTNNELAK | 0.000 | 0.000 | 0.000 | 0.577 | 0.000 | 0.000 | 0.423 | 0.000 |
| Plot | Mito | Lyso or Perox | ER | Golgi | PM | Cytosol | Nucleus | ||||||
| Expt B |
2 peptides |
3 spectra |
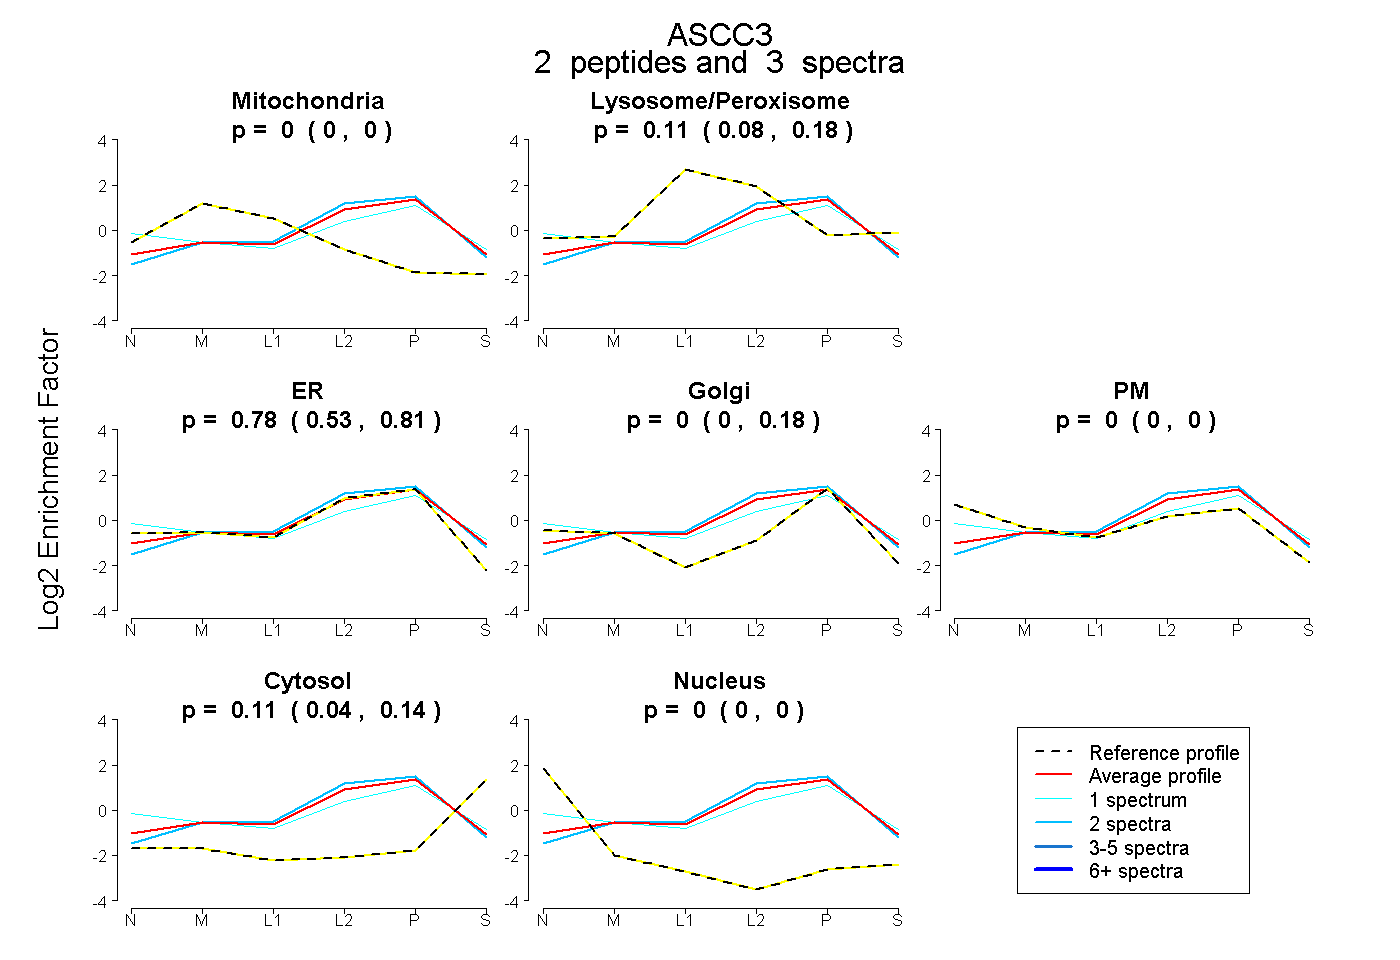 |
0.000 0.000 | 0.000 |
0.114 0.077 | 0.181 |
0.775 0.530 | 0.811 |
0.000 0.000 | 0.180 |
0.000 0.000 | 0.000 |
0.111 0.041 | 0.142 |
0.000 0.000 | 0.000 |
|||
| Plot | Lyso | Other | |||||||||||
| Expt C |
6 peptides |
12 spectra |
 |
0.000 0.000 | 0.000 |
1.000 1.000 | 1.000 |
||||||||
| Plot | Lyso | Other | |||||||||||
| Expt D |
1 peptide |
1 spectrum |
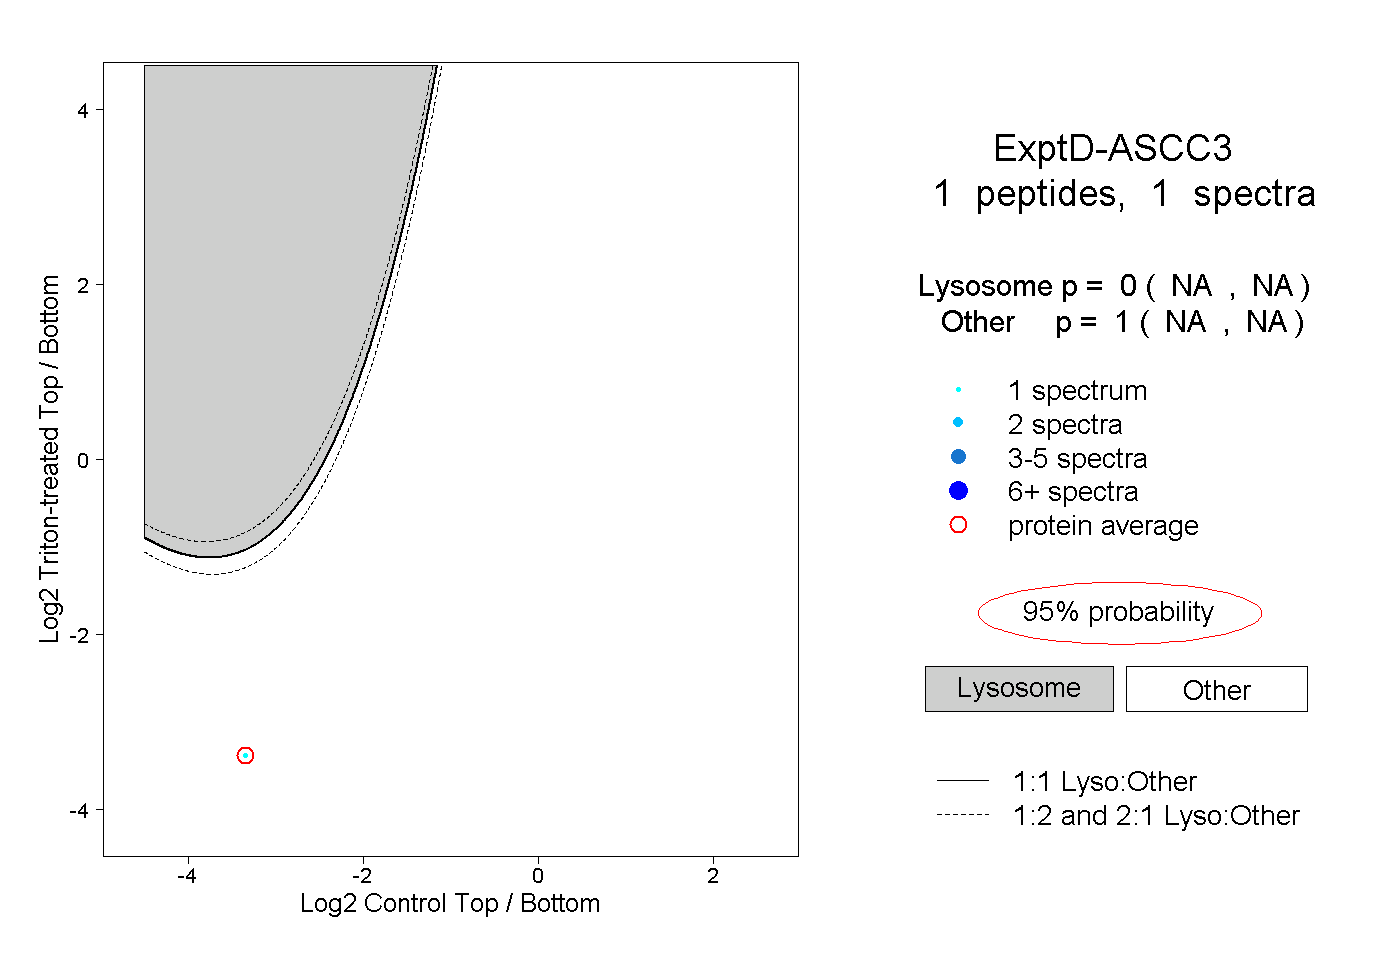 |
0.000 NA | NA |
1.000 NA | NA |