 8
8peptides
spectra
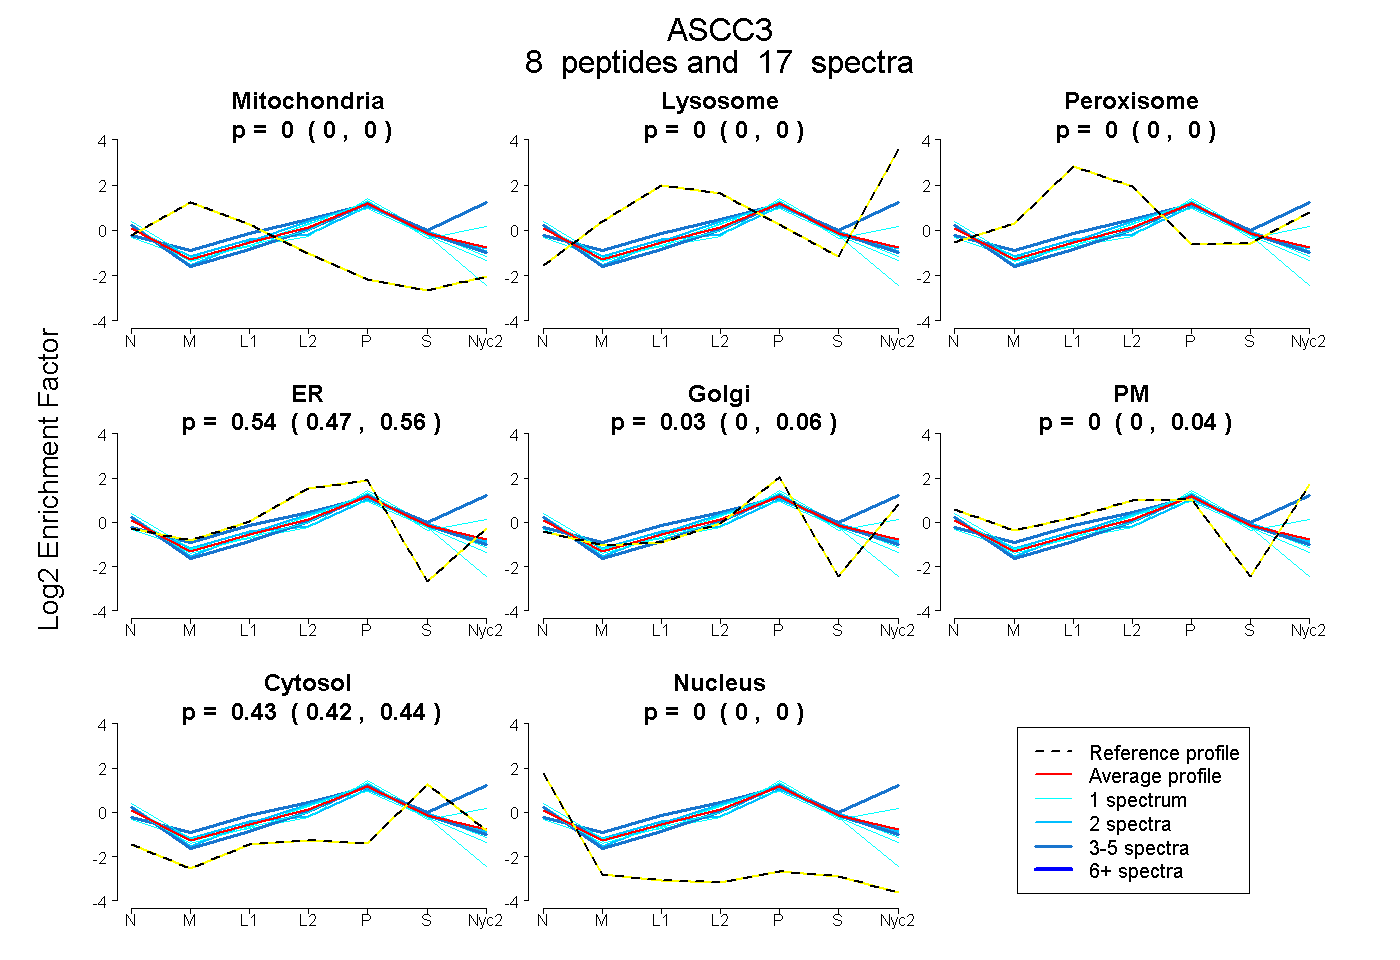
0.000 | 0.000
0.000 | 0.000
0.000 | 0.000
0.469 | 0.564
0.000 | 0.057
0.000 | 0.043
0.422 | 0.440
0.000 | 0.000
2peptides
spectra
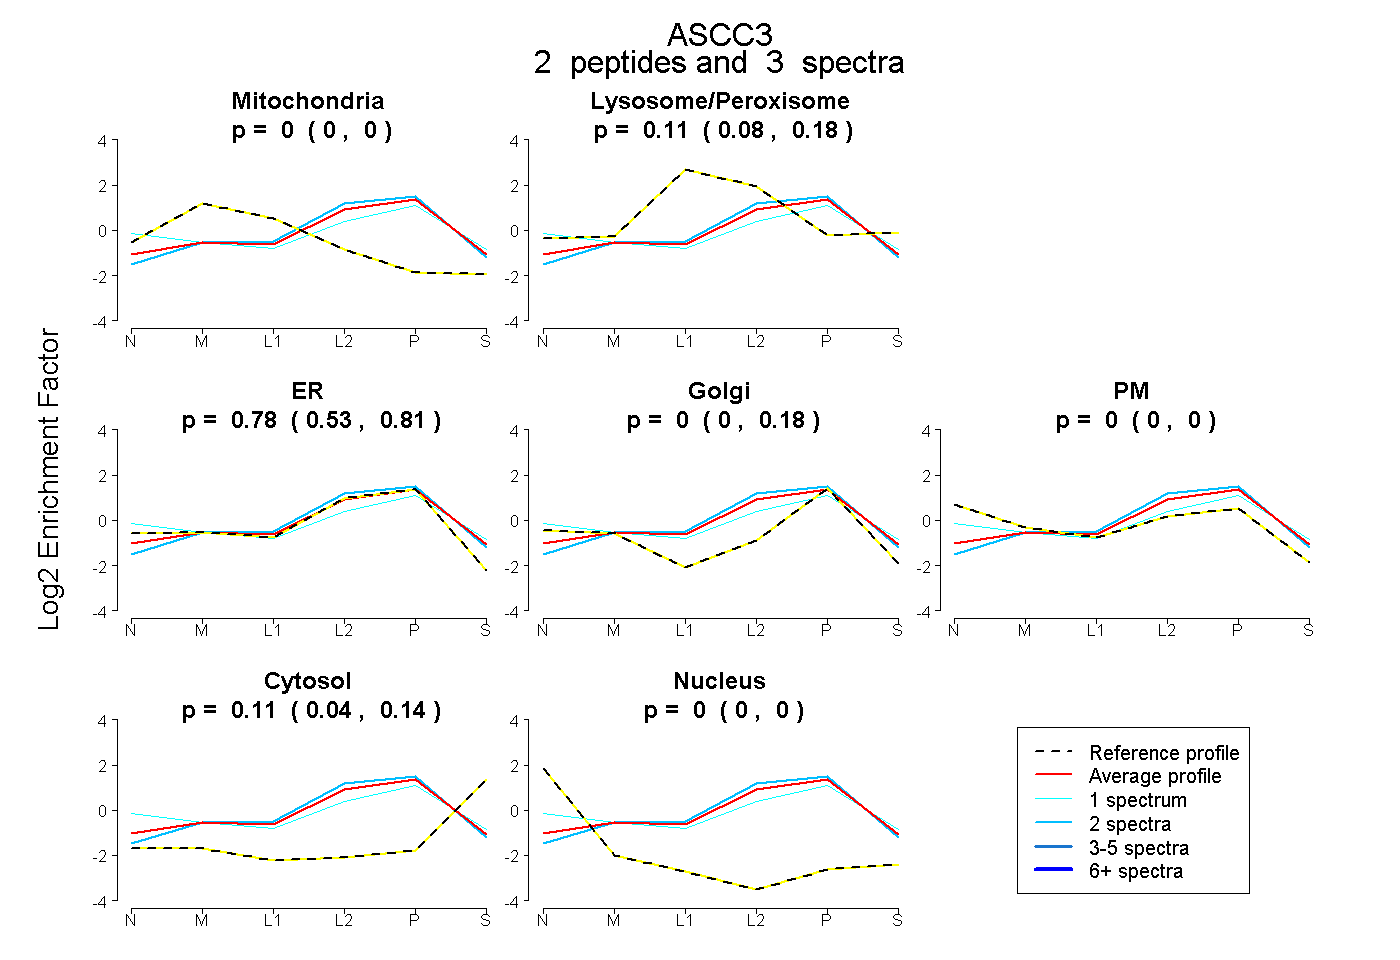
0.000 | 0.000
0.077 | 0.181
0.530 | 0.811
0.000 | 0.180
0.000 | 0.000
0.041 | 0.142
0.000 | 0.000
6peptides
spectra
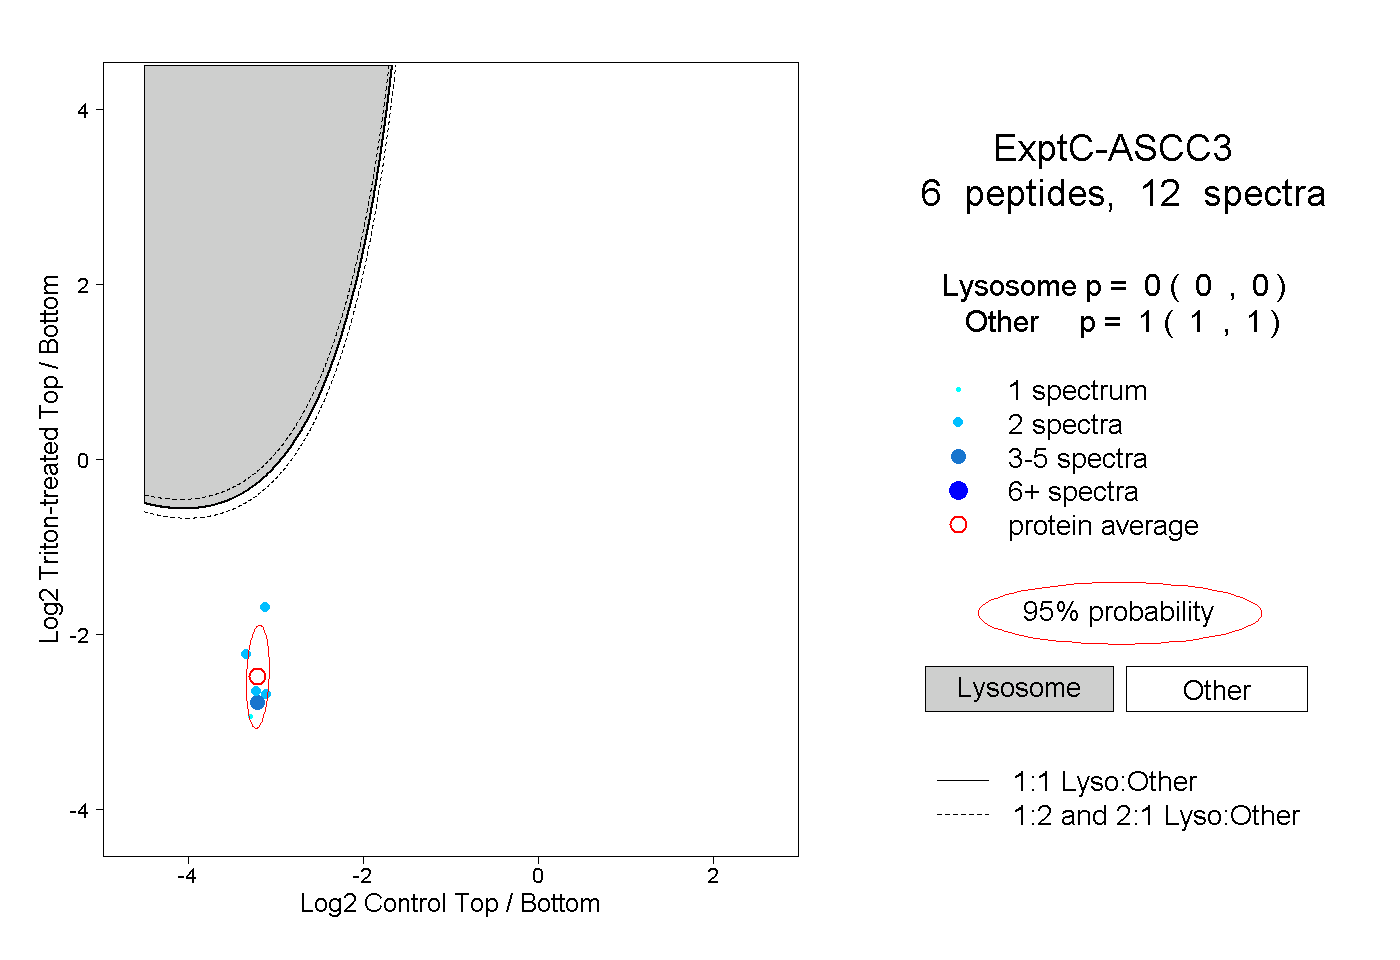
0.000 | 0.000
1.000 | 1.000
1peptide
spectrum
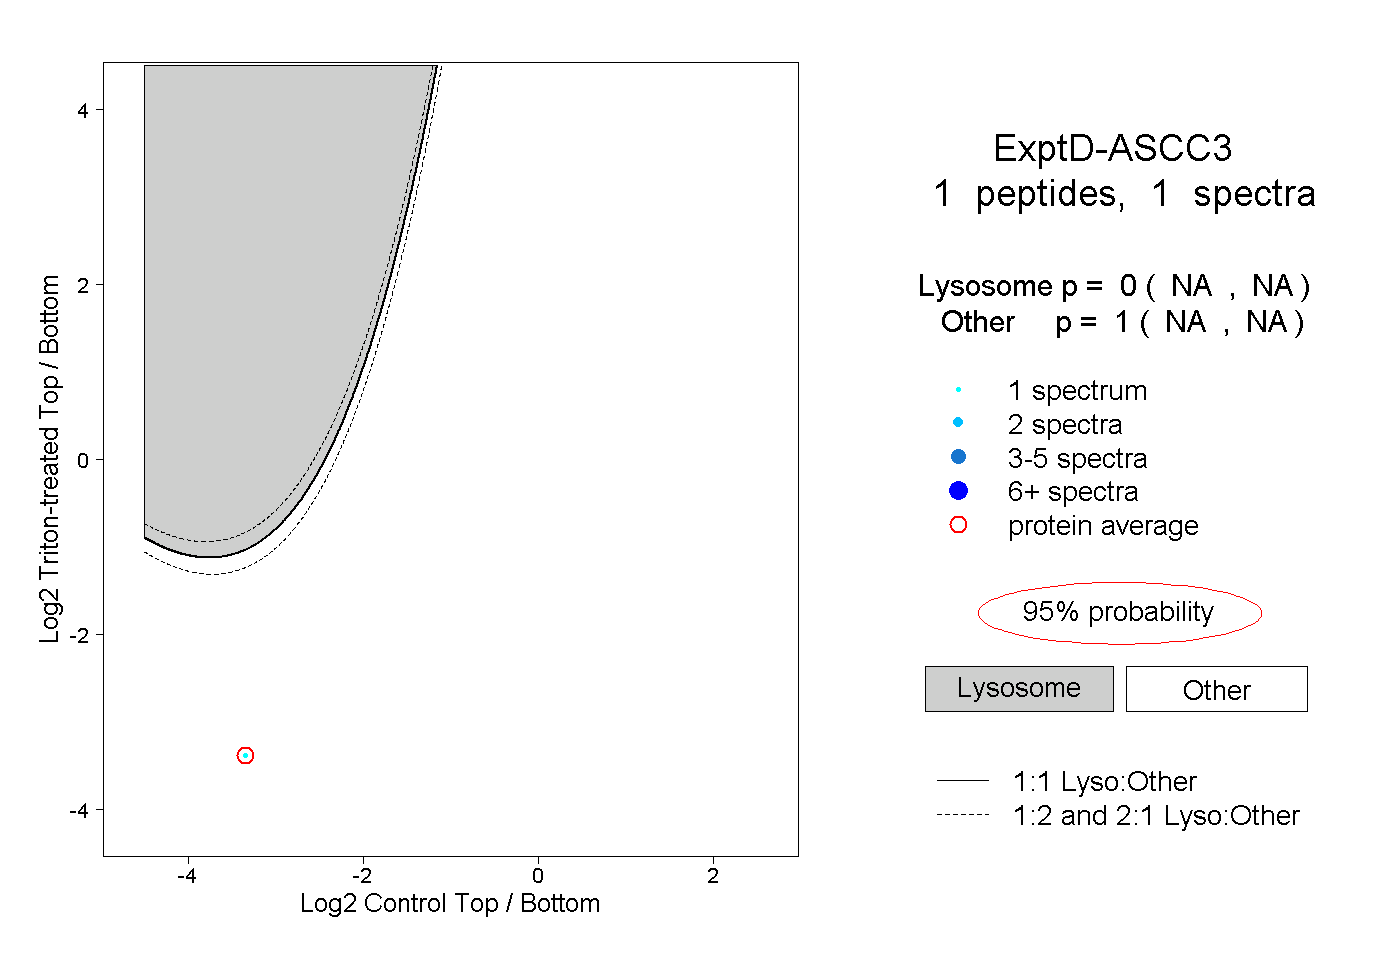
NA | NA
NA | NA