 1
1peptide
spectra
0.000 | 0.000
0.000 | 0.000
0.000 | 0.213
0.000 | 0.245
0.058 | 0.388
0.157 | 0.459
0.016 | 0.237
0.079 | 0.152
2peptides
spectra
0.000 | 0.000
1.000 | 1.000
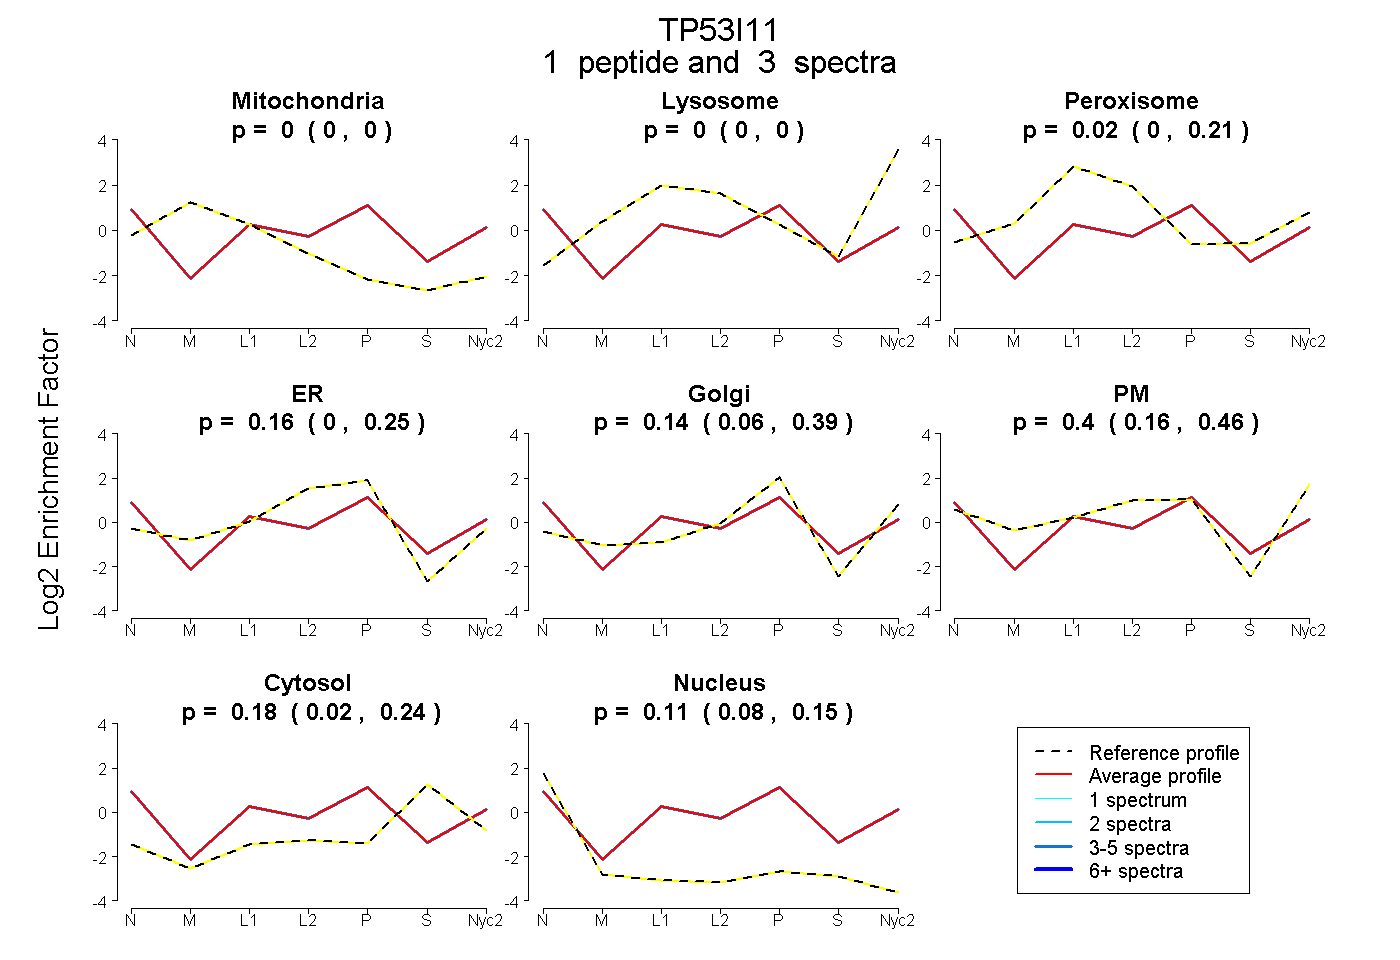
| Plot | Mito | Lyso | Perox | ER | Golgi | PM | Cytosol | Nucleus | |||||
| Expt A |
1 peptide |
3 spectra |
|
0.000 0.000 | 0.000 |
0.000 0.000 | 0.000 |
0.025 0.000 | 0.213 |
0.156 0.000 | 0.245 |
0.136 0.058 | 0.388 |
0.397 0.157 | 0.459 |
0.179 0.016 | 0.237 |
0.107 0.079 | 0.152 |
||
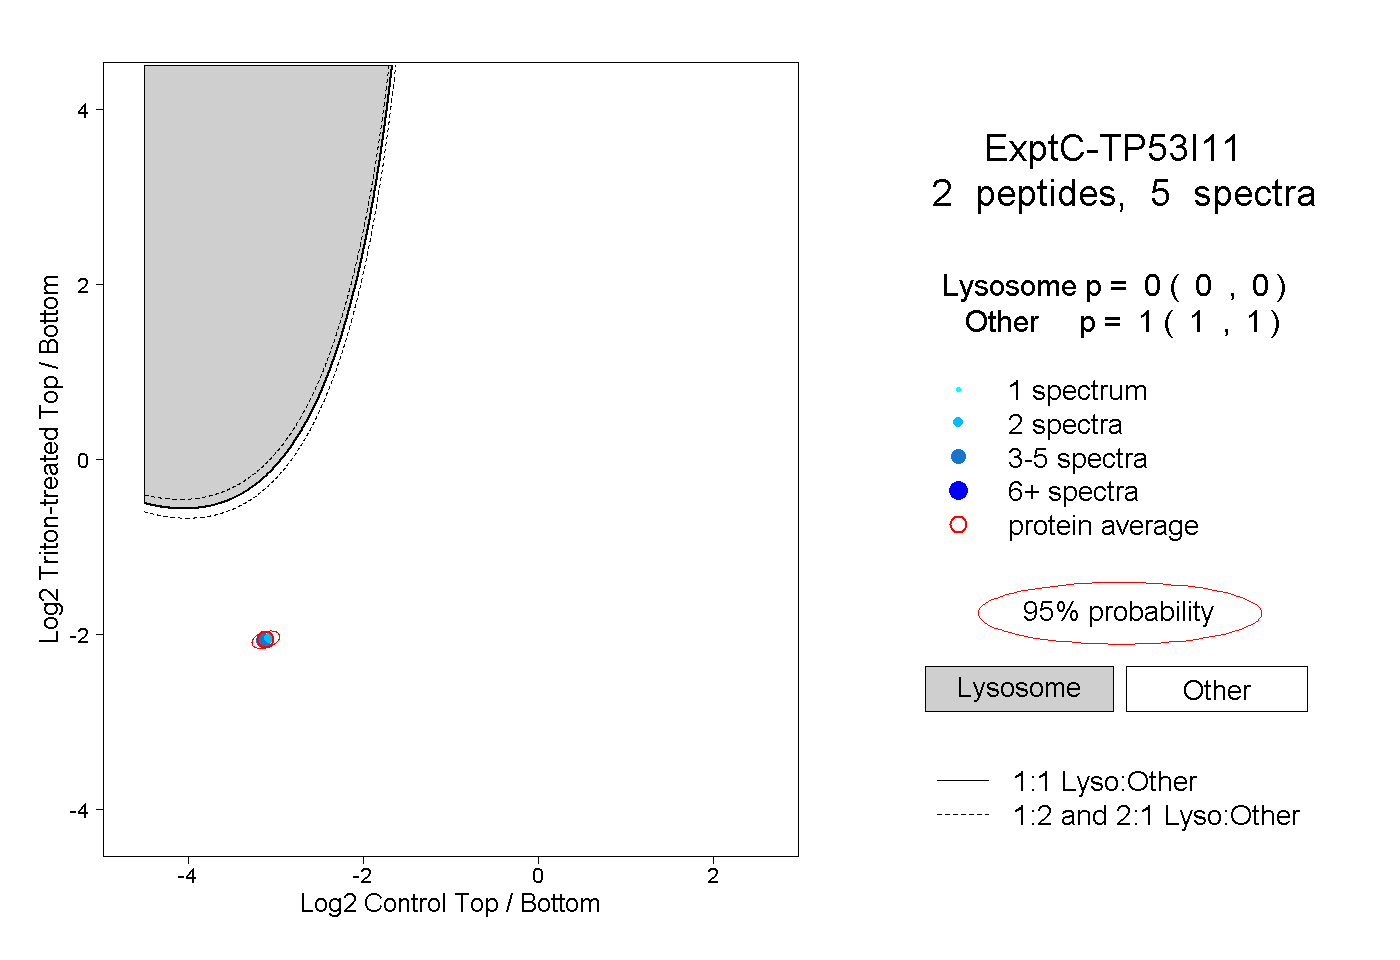
| Plot | Lyso | Other | |||||||||||
| Expt C |
2 peptides |
5 spectra |
|
0.000 0.000 | 0.000 |
1.000 1.000 | 1.000 |