 4
4peptides
spectra
0.000 | 0.000
0.000 | 0.000
0.024 | 0.090
0.000 | 0.000
0.000 | 0.000
0.576 | 0.616
0.313 | 0.367
0.000 | 0.000
3peptides
spectra
0.000 | 1.000
0.000 | 1.000
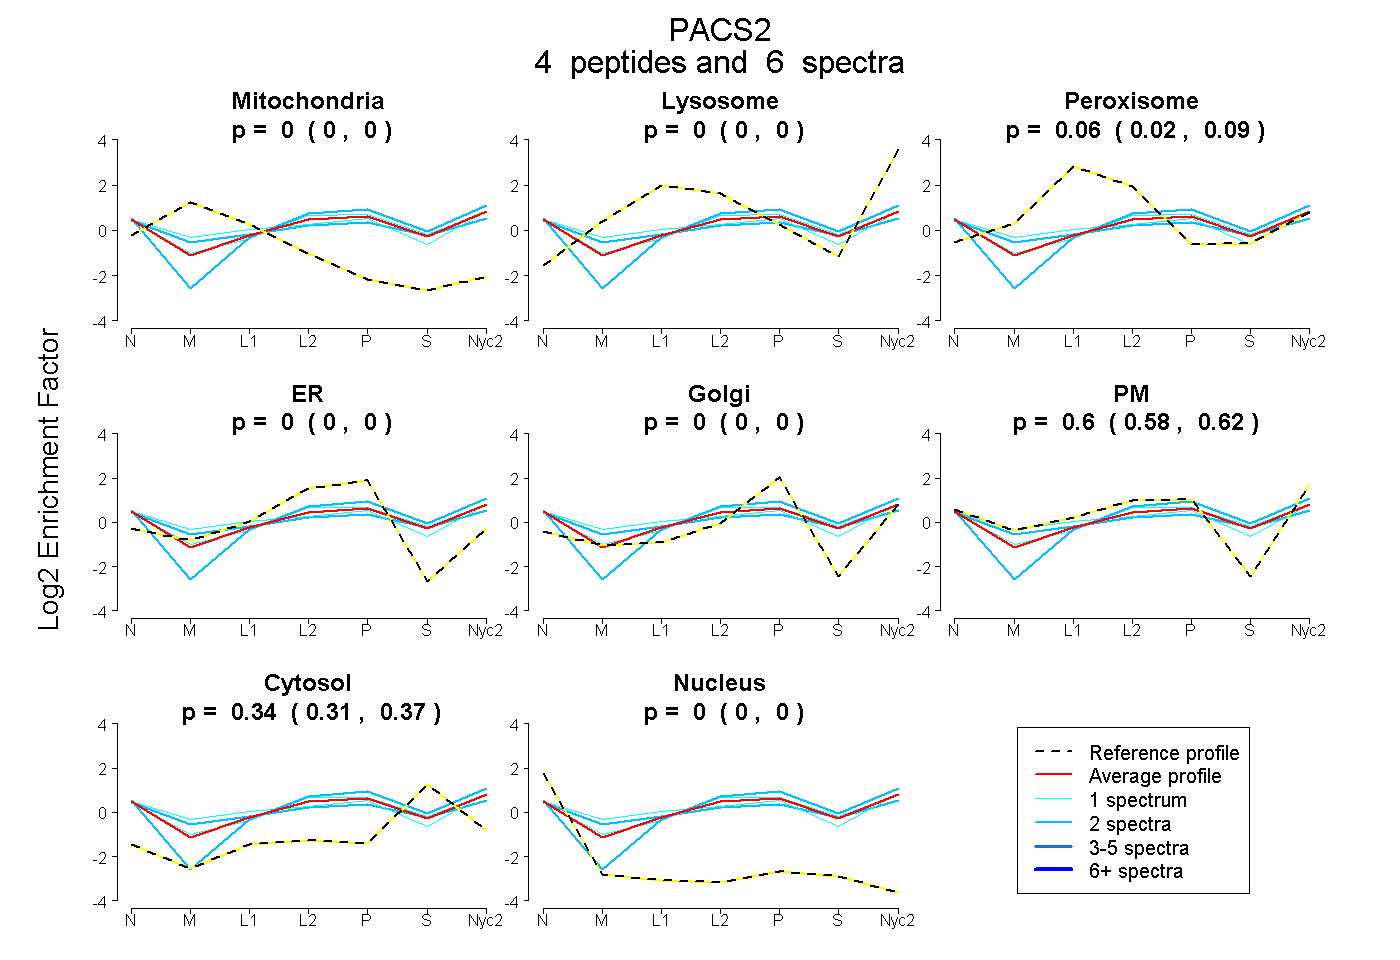
| Plot | Mito | Lyso | Perox | ER | Golgi | PM | Cytosol | Nucleus | |||||
| Expt A |
4 peptides |
6 spectra |
|
0.000 0.000 | 0.000 |
0.000 0.000 | 0.000 |
0.060 0.024 | 0.090 |
0.000 0.000 | 0.000 |
0.000 0.000 | 0.000 |
0.599 0.576 | 0.616 |
0.342 0.313 | 0.367 |
0.000 0.000 | 0.000 |
||
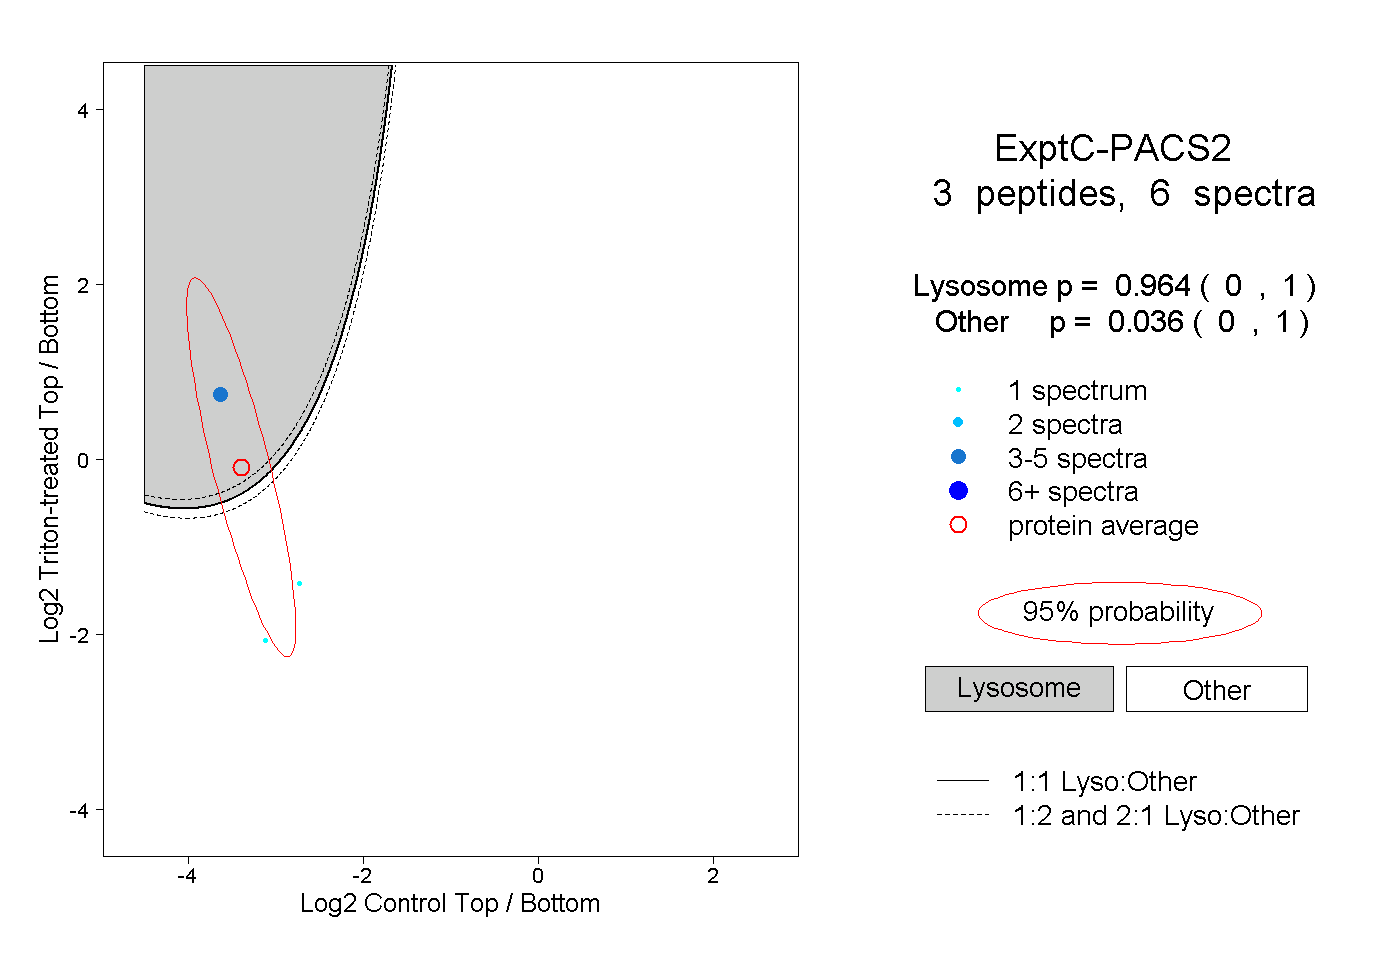
| Plot | Lyso | Other | |||||||||||
| Expt C |
3 peptides |
6 spectra |
|
0.964 0.000 | 1.000 |
0.036 0.000 | 1.000 |