 2
2peptides
spectra
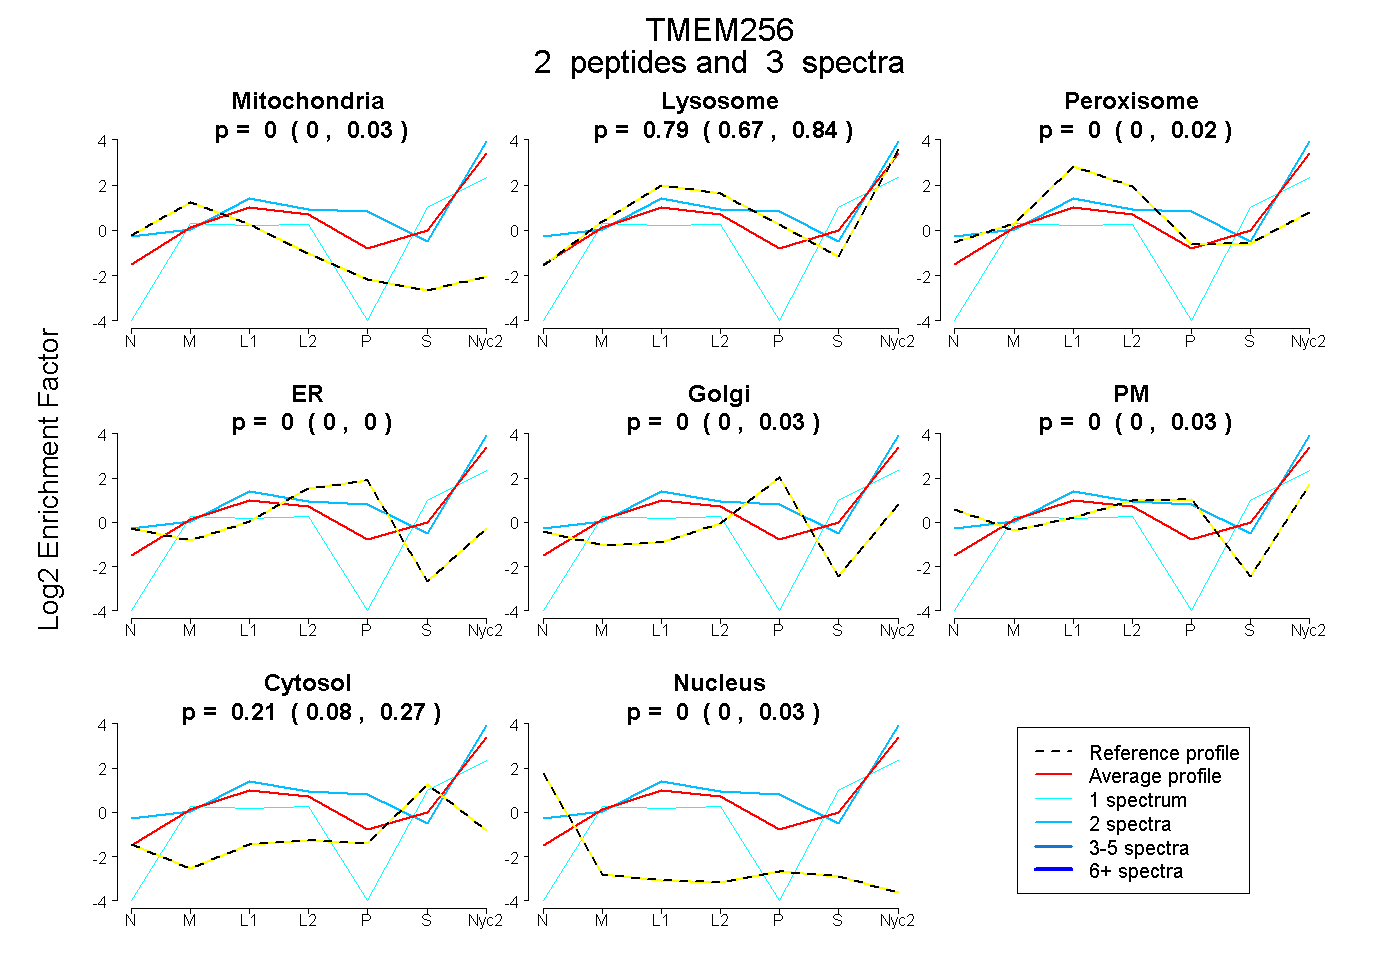
0.000 | 0.027
0.668 | 0.845
0.000 | 0.016
0.000 | 0.000
0.000 | 0.026
0.000 | 0.032
0.082 | 0.274
0.000 | 0.028
1peptide
spectra
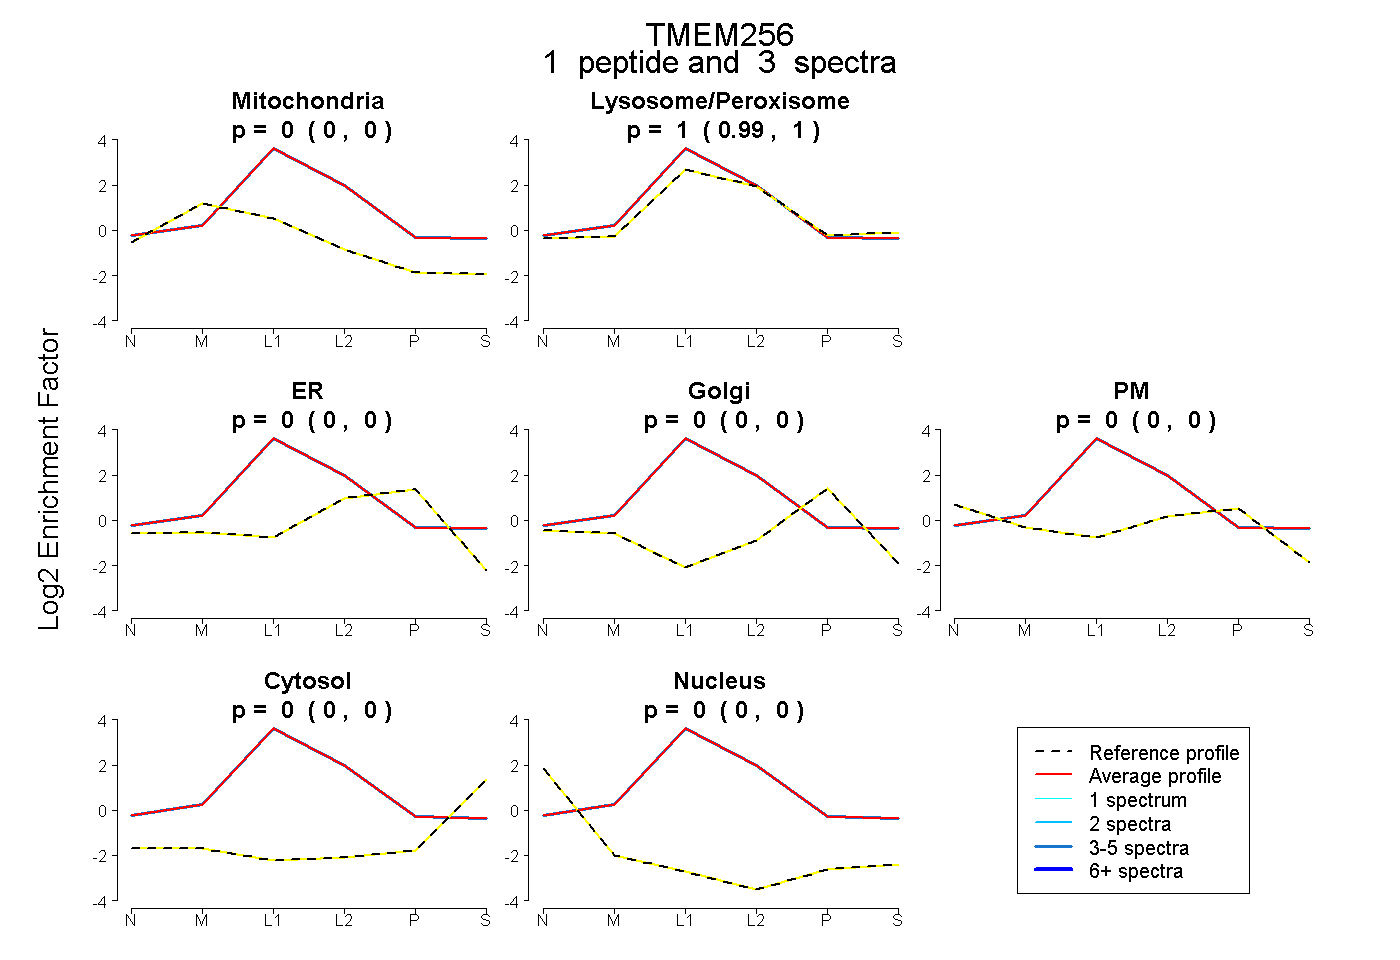
0.000 | 0.000
0.993 | 1.000
0.000 | 0.000
0.000 | 0.000
0.000 | 0.000
0.000 | 0.000
0.000 | 0.000
1peptide
spectra
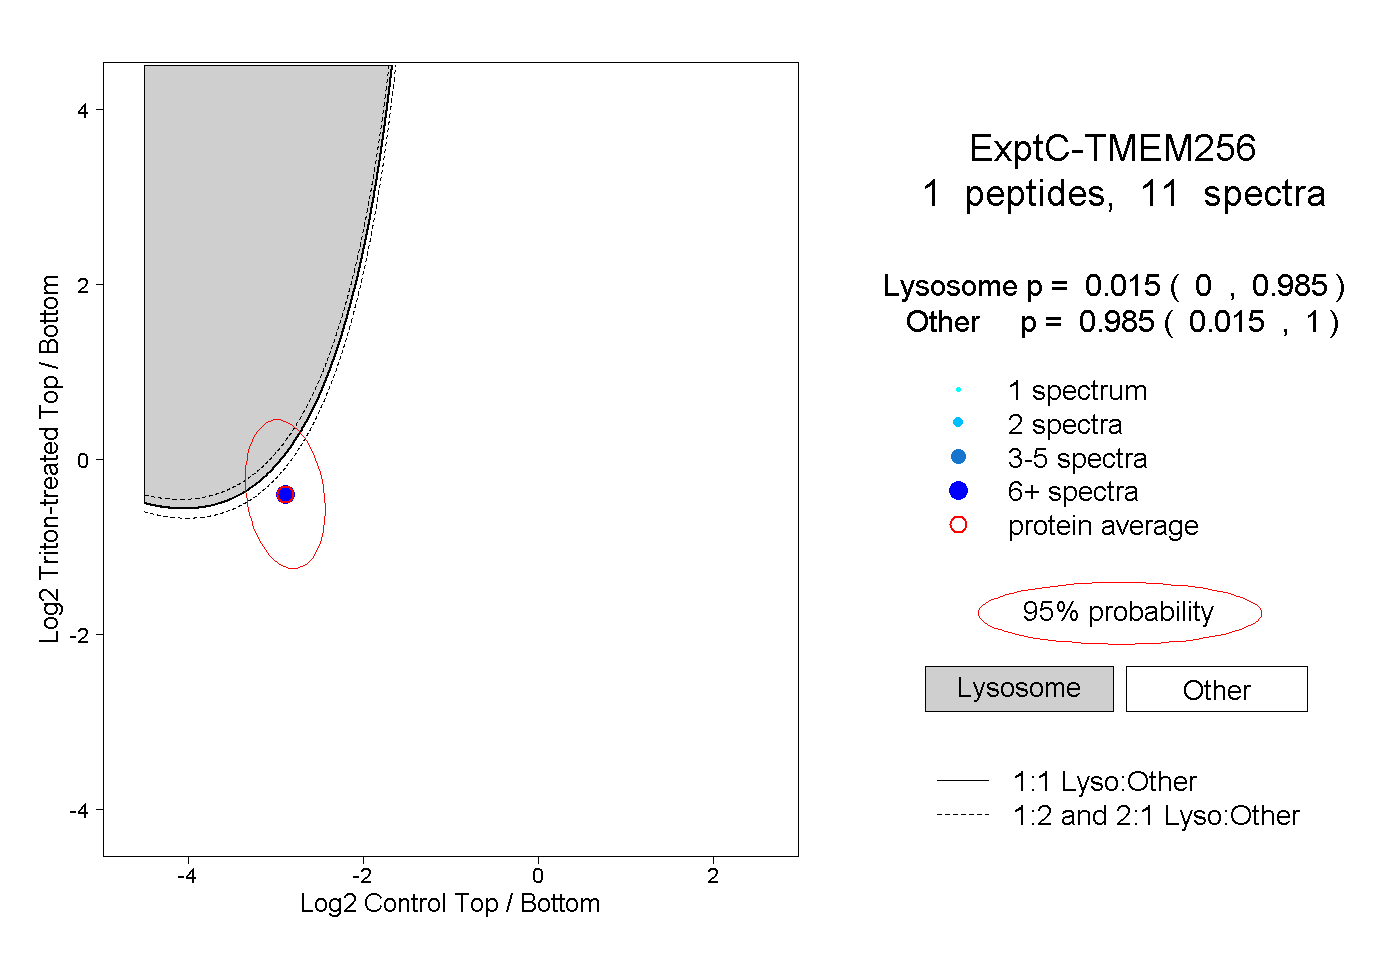
0.000 | 0.985
0.015 | 1.000