15
15peptides
spectra
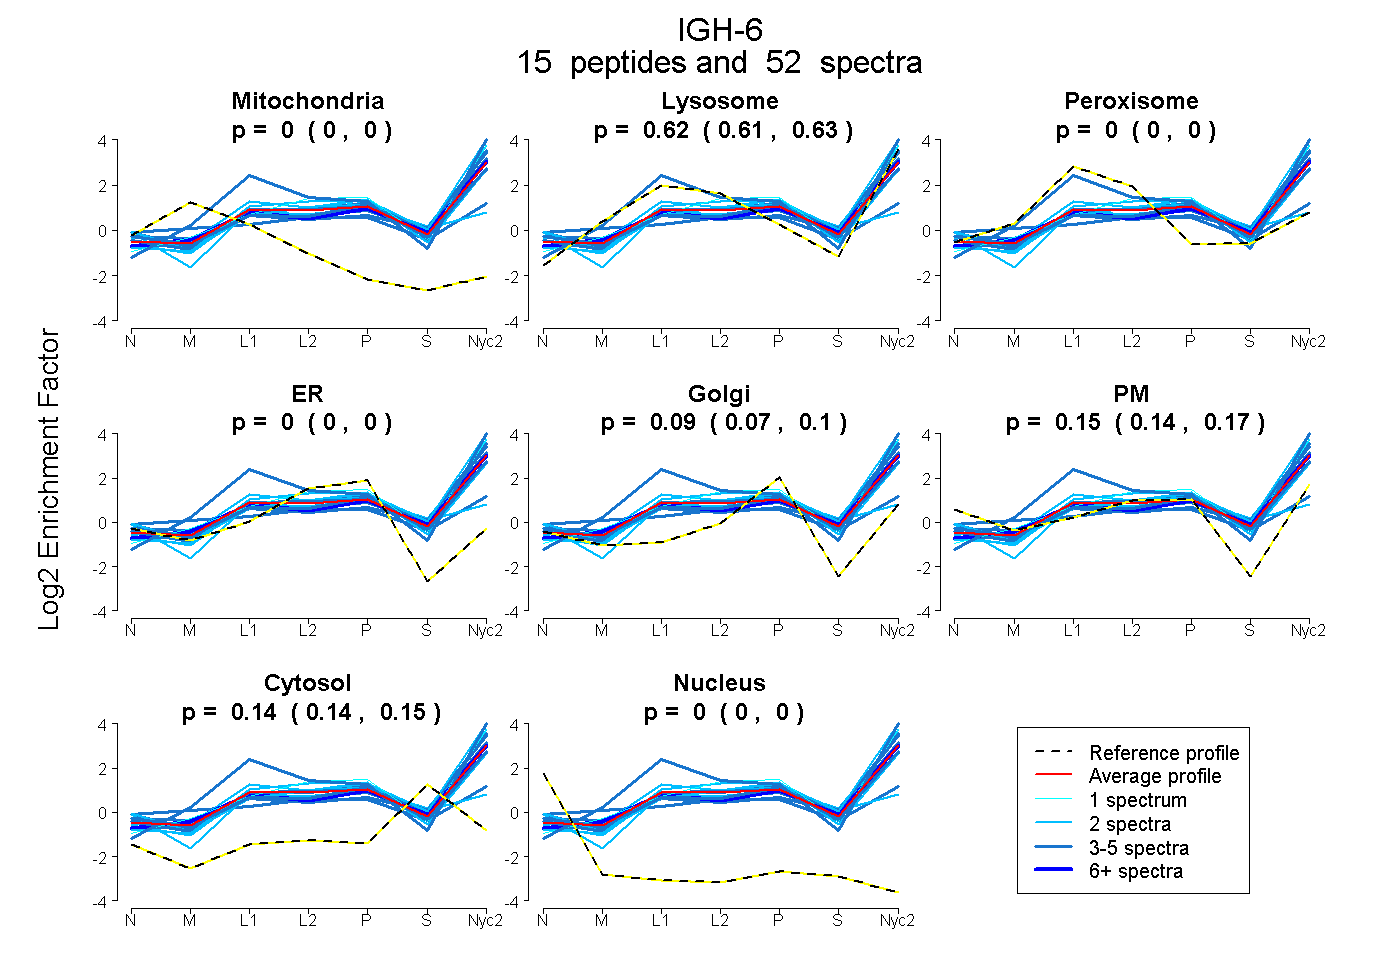
0.000 | 0.000
0.607 | 0.627
0.000 | 0.000
0.000 | 0.000
0.074 | 0.097
0.138 | 0.167
0.136 | 0.146
0.000 | 0.000
16peptides
spectra
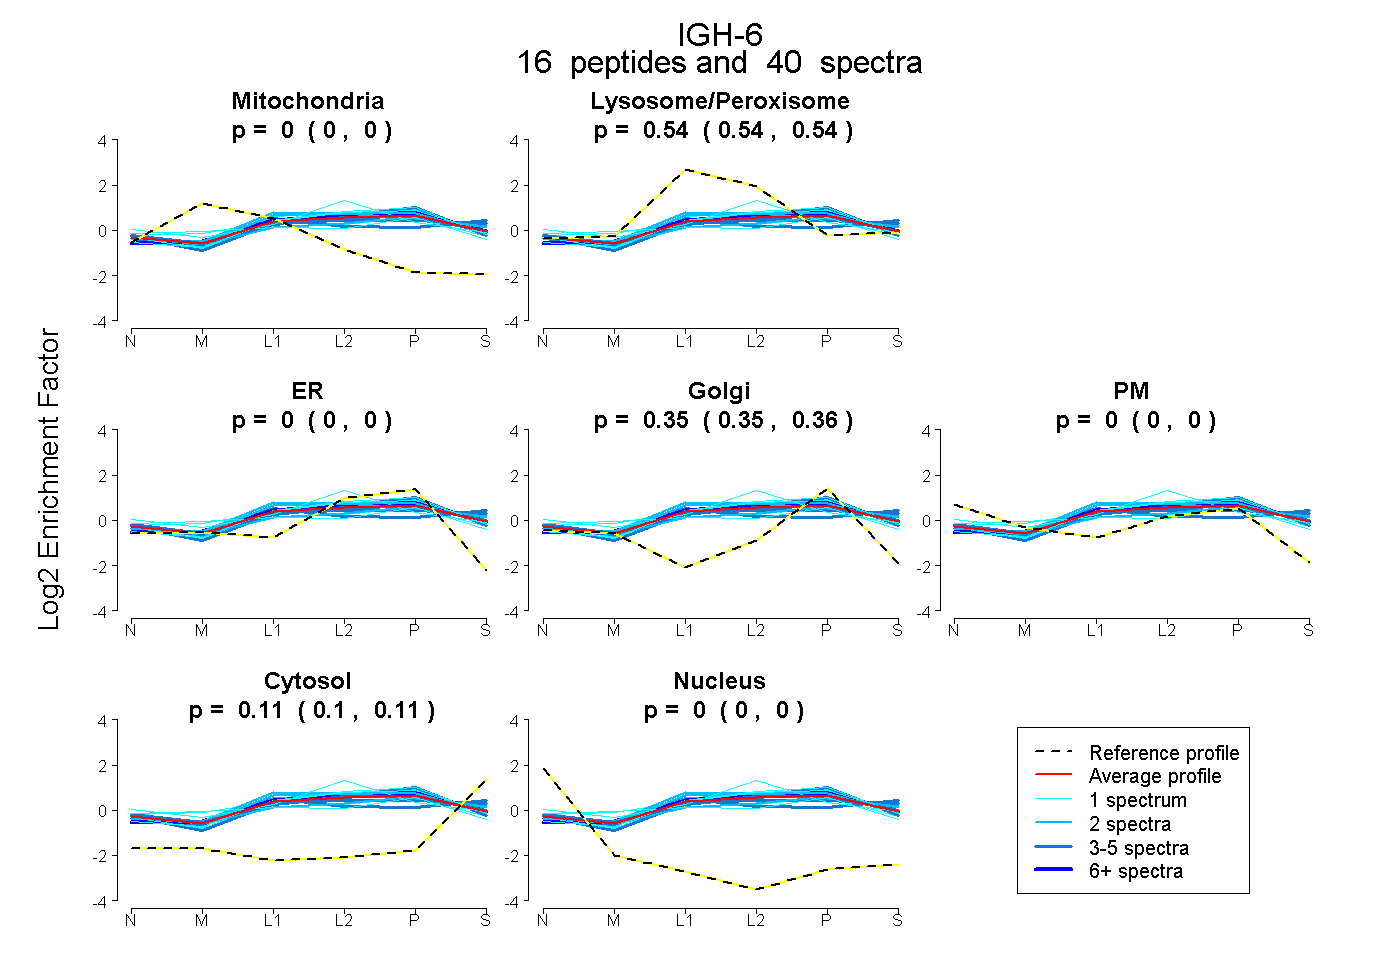
0.000 | 0.000
0.538 | 0.543
0.000 | 0.000
0.349 | 0.356
0.000 | 0.000
0.103 | 0.110
0.000 | 0.000