 15
15peptides
spectra
0.000 | 0.000
0.607 | 0.627
0.000 | 0.000
0.000 | 0.000
0.074 | 0.097
0.138 | 0.167
0.136 | 0.146
0.000 | 0.000
| Plot | Mito | Lyso | Perox | ER | Golgi | PM | Cytosol | Nucleus | |||||
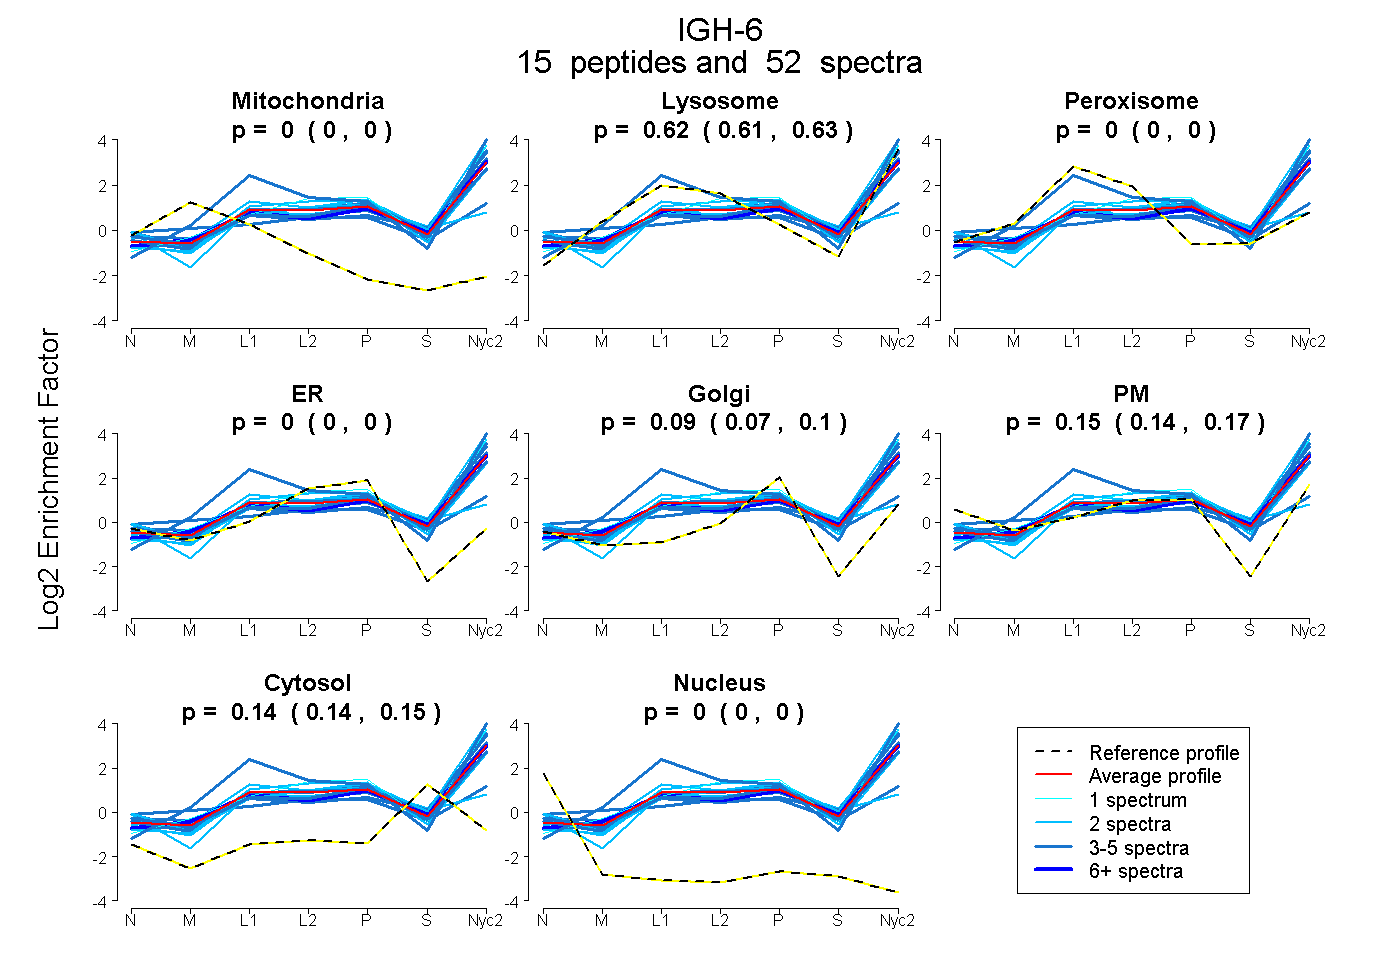
| Expt A |
15 peptides |
52 spectra |
|
0.000 0.000 | 0.000 |
0.618 0.607 | 0.627 |
0.000 0.000 | 0.000 |
0.000 0.000 | 0.000 |
0.087 0.074 | 0.097 |
0.154 0.138 | 0.167 |
0.142 0.136 | 0.146 |
0.000 0.000 | 0.000 |
| 2 spectra, SGFTTEPVTVEAK | 0.000 | 0.804 | 0.000 | 0.000 | 0.115 | 0.000 | 0.081 | 0.000 | ||
| 5 spectra, GQPLSSDK | 0.000 | 0.522 | 0.000 | 0.000 | 0.000 | 0.250 | 0.228 | 0.000 | ||
| 2 spectra, EPTGAVFTWQPTTGK | 0.000 | 0.568 | 0.000 | 0.000 | 0.000 | 0.232 | 0.199 | 0.000 | ||
| 5 spectra, DAFSGPAPR | 0.000 | 0.545 | 0.000 | 0.000 | 0.000 | 0.276 | 0.178 | 0.000 | ||
| 5 spectra, YYVQYNTSPVR | 0.000 | 1.000 | 0.000 | 0.000 | 0.000 | 0.000 | 0.000 | 0.000 | ||
| 1 spectrum, TFPTLR | 0.000 | 0.764 | 0.000 | 0.000 | 0.234 | 0.000 | 0.001 | 0.000 | ||
| 2 spectra, EPGEGAITYLVTSVLR | 0.000 | 0.628 | 0.000 | 0.000 | 0.144 | 0.097 | 0.131 | 0.000 | ||
| 3 spectra, SGEPLETNTK | 0.000 | 0.683 | 0.000 | 0.000 | 0.041 | 0.128 | 0.149 | 0.000 | ||
| 4 spectra, EFVCTVTHR | 0.000 | 0.136 | 0.194 | 0.000 | 0.064 | 0.386 | 0.219 | 0.000 | ||
| 9 spectra, HPPAVYLLPPAR | 0.000 | 0.665 | 0.000 | 0.000 | 0.177 | 0.000 | 0.158 | 0.000 | ||
| 2 spectra, GSRPQTYK | 0.000 | 0.720 | 0.000 | 0.000 | 0.017 | 0.195 | 0.068 | 0.000 | ||
| 3 spectra, VSAETWK | 0.000 | 0.501 | 0.000 | 0.000 | 0.130 | 0.220 | 0.148 | 0.000 | ||
| 2 spectra, LICEATNFSPK | 0.000 | 0.426 | 0.000 | 0.000 | 0.110 | 0.360 | 0.105 | 0.000 | ||
| 5 spectra, GLTFWK | 0.000 | 0.725 | 0.000 | 0.000 | 0.148 | 0.000 | 0.127 | 0.000 | ||
| 2 spectra, ESATVTCLVK | 0.000 | 0.179 | 0.259 | 0.193 | 0.140 | 0.000 | 0.228 | 0.000 |
| Plot | Mito | Lyso or Perox | ER | Golgi | PM | Cytosol | Nucleus | ||||||
| Expt B |
16 peptides |
40 spectra |
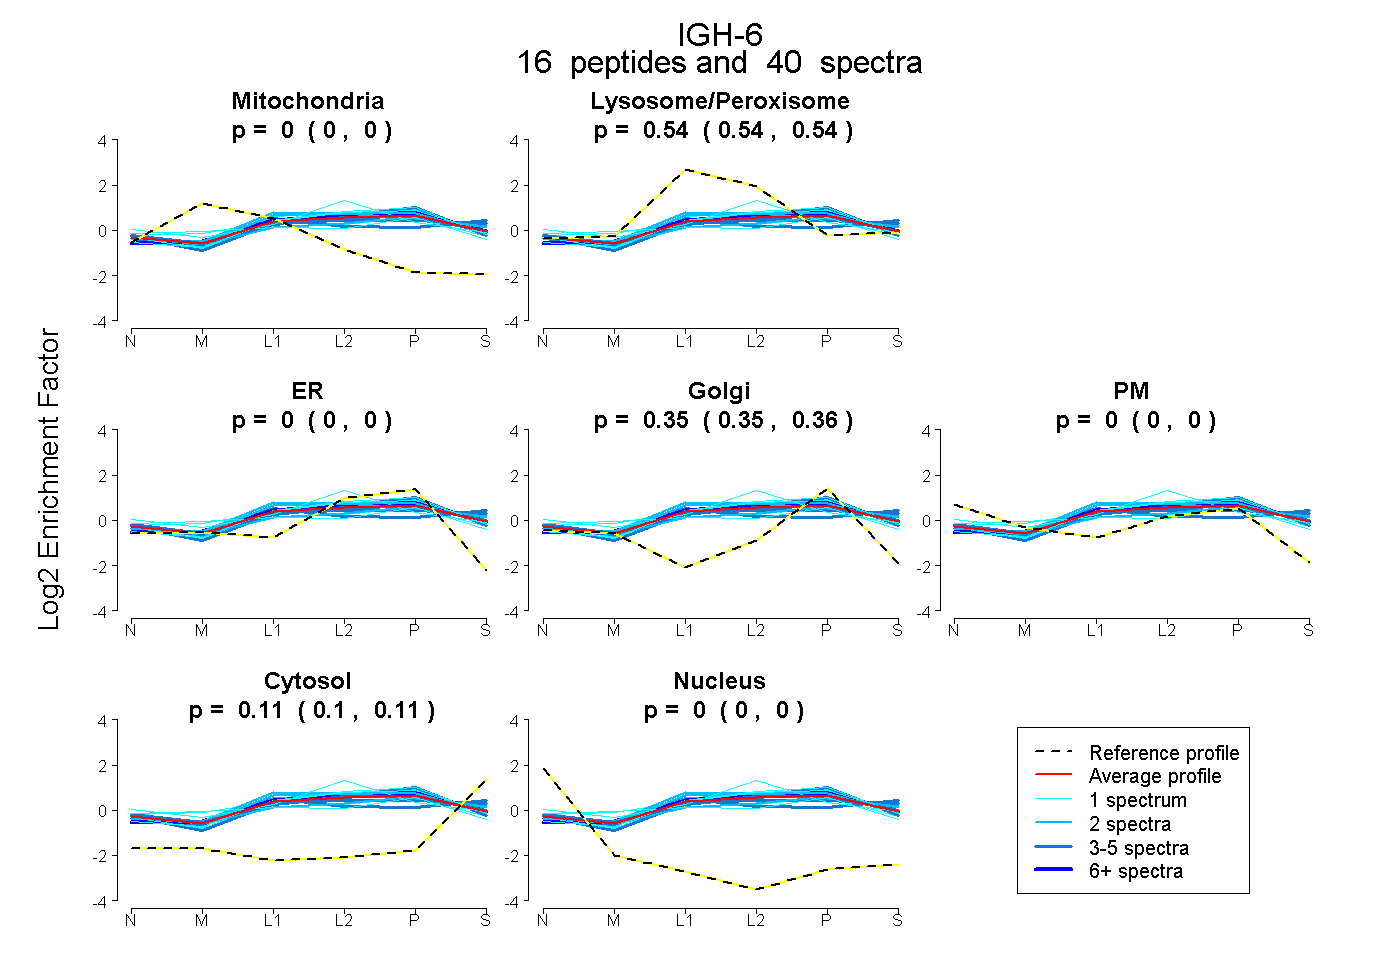 |
0.000 0.000 | 0.000 |
0.540 0.538 | 0.543 |
0.000 0.000 | 0.000 |
0.353 0.349 | 0.356 |
0.000 0.000 | 0.000 |
0.107 0.103 | 0.110 |
0.000 0.000 | 0.000 |
|||
| Plot | Lyso | Other | |||||||||||
| Expt C |
22 peptides |
217 spectra |
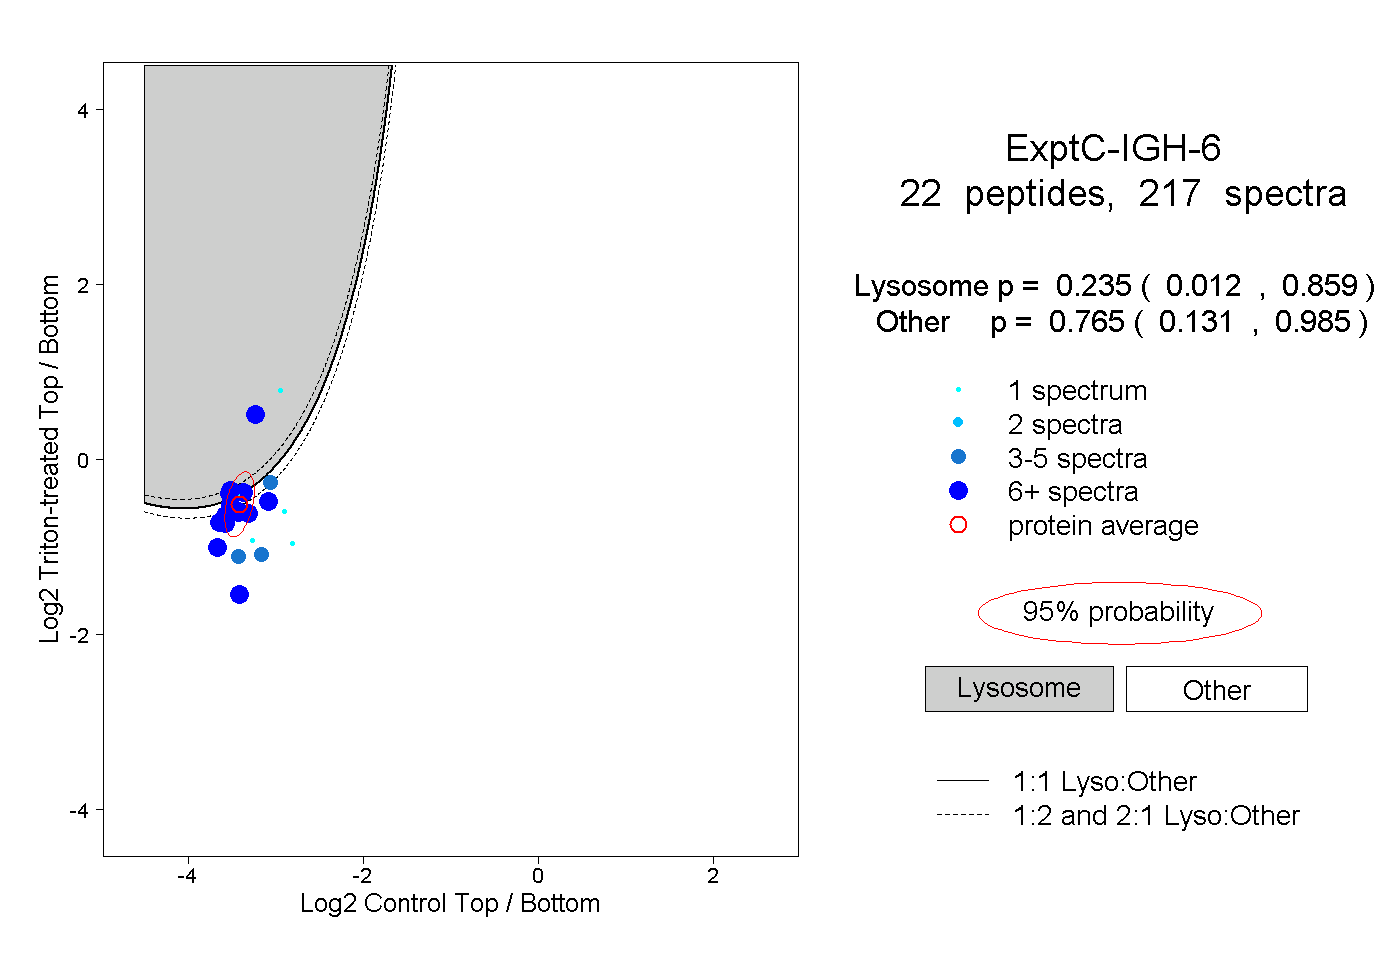 |
0.235 0.012 | 0.859 |
0.765 0.131 | 0.985 |
||||||||
| Plot | Lyso | Other | |||||||||||
| Expt D |
10 peptides |
18 spectra |
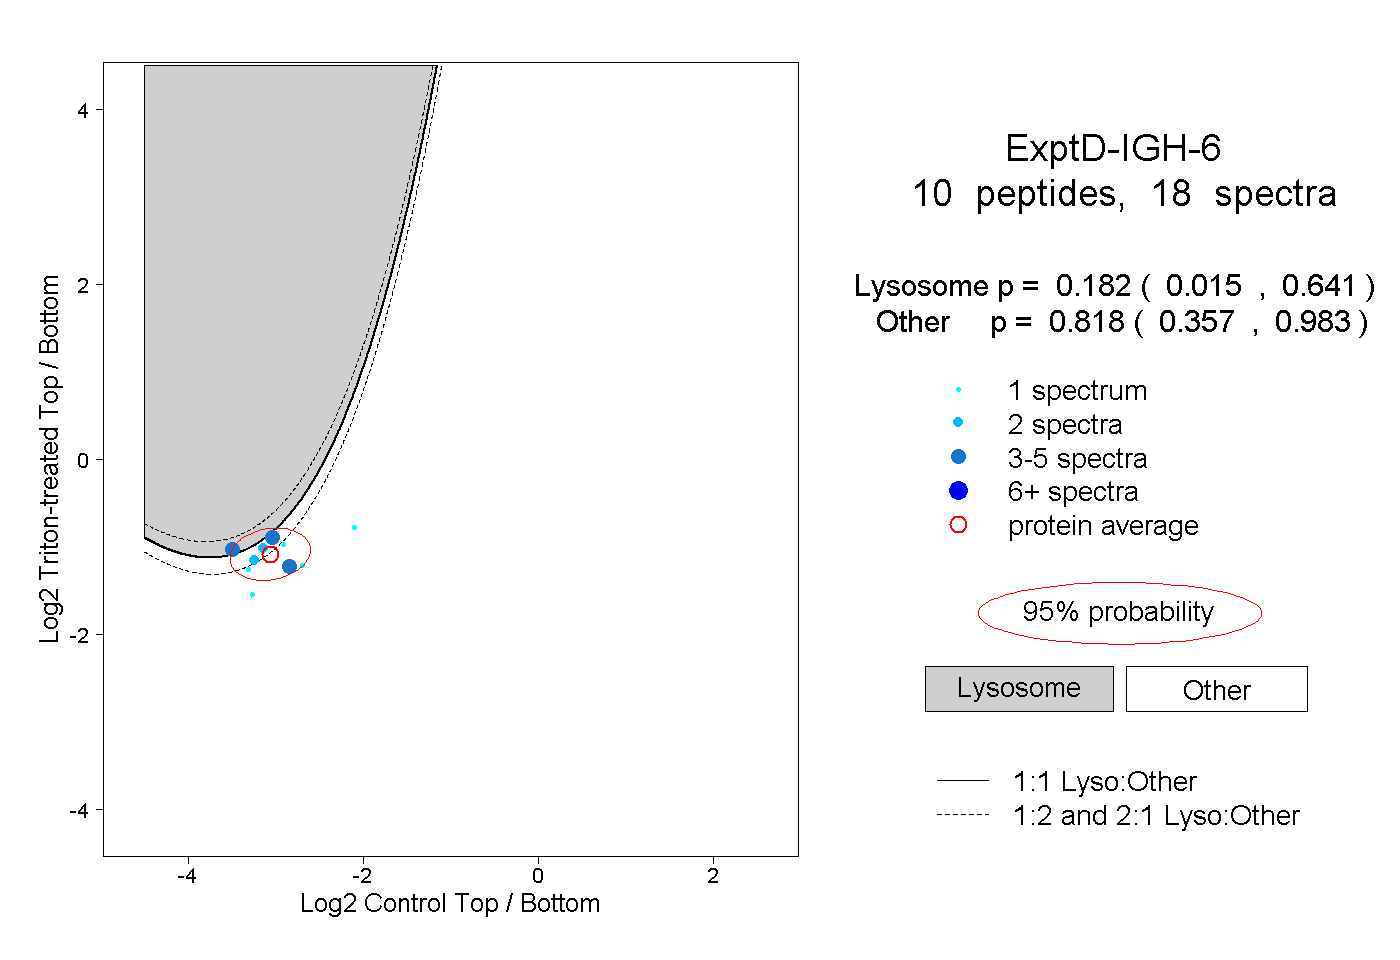 |
0.182 0.015 | 0.641 |
0.818 0.357 | 0.983 |