 3
3peptides
spectra
0.000 | 0.042
0.016 | 0.205
0.000 | 0.038
0.000 | 0.054
0.573 | 0.827
0.000 | 0.286
0.000 | 0.042
0.000 | 0.000
5peptides
spectra
0.000 | 0.000
1.000 | 1.000
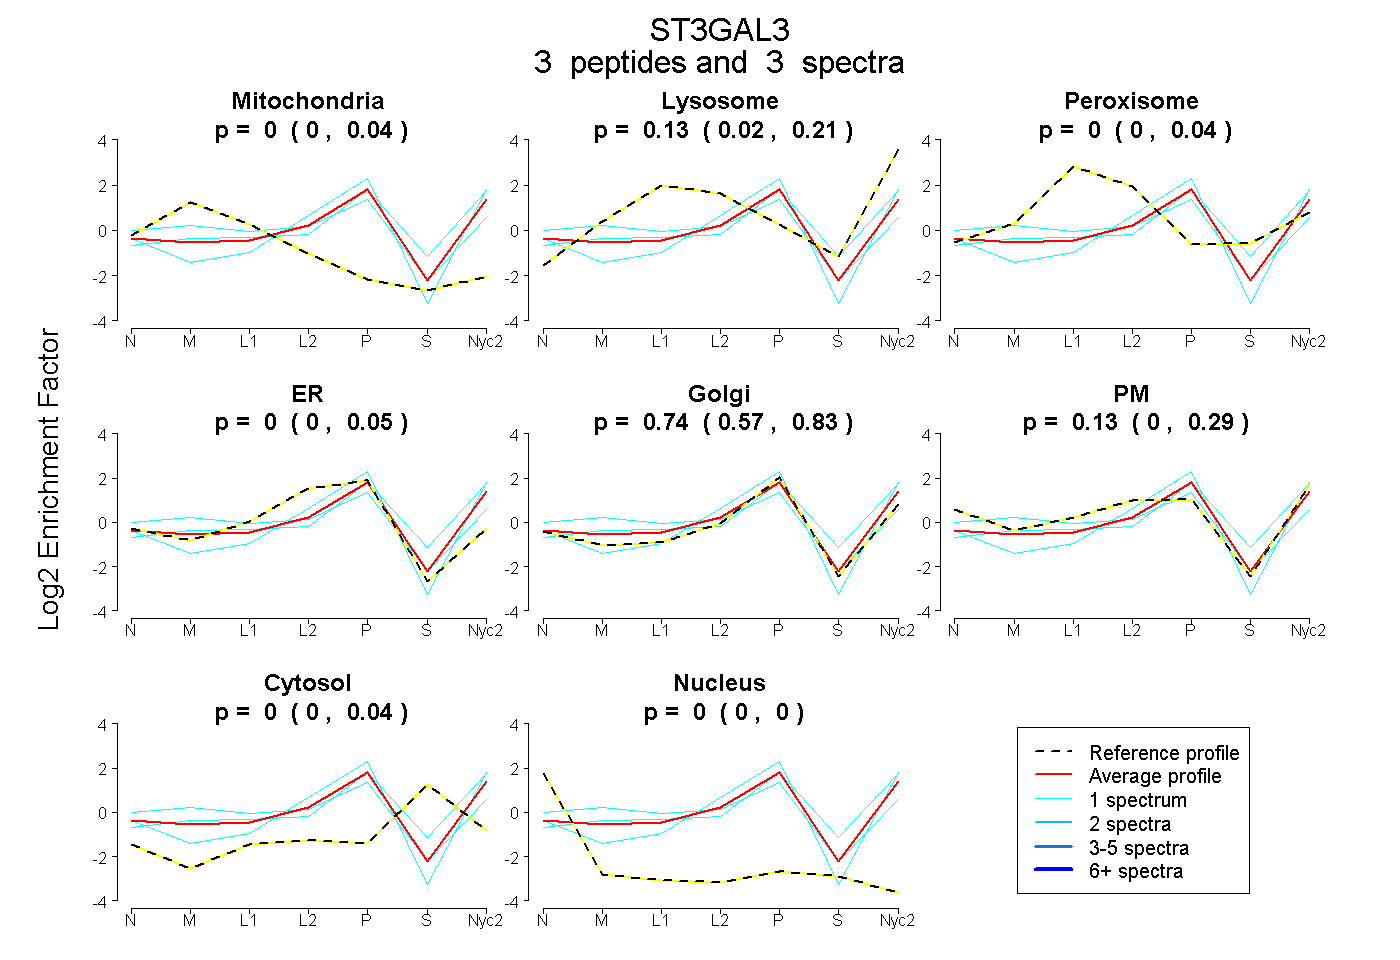
| Plot | Mito | Lyso | Perox | ER | Golgi | PM | Cytosol | Nucleus | |||||
| Expt A |
3 peptides |
3 spectra |
|
0.000 0.000 | 0.042 |
0.128 0.016 | 0.205 |
0.000 0.000 | 0.038 |
0.000 0.000 | 0.054 |
0.739 0.573 | 0.827 |
0.134 0.000 | 0.286 |
0.000 0.000 | 0.042 |
0.000 0.000 | 0.000 |
||
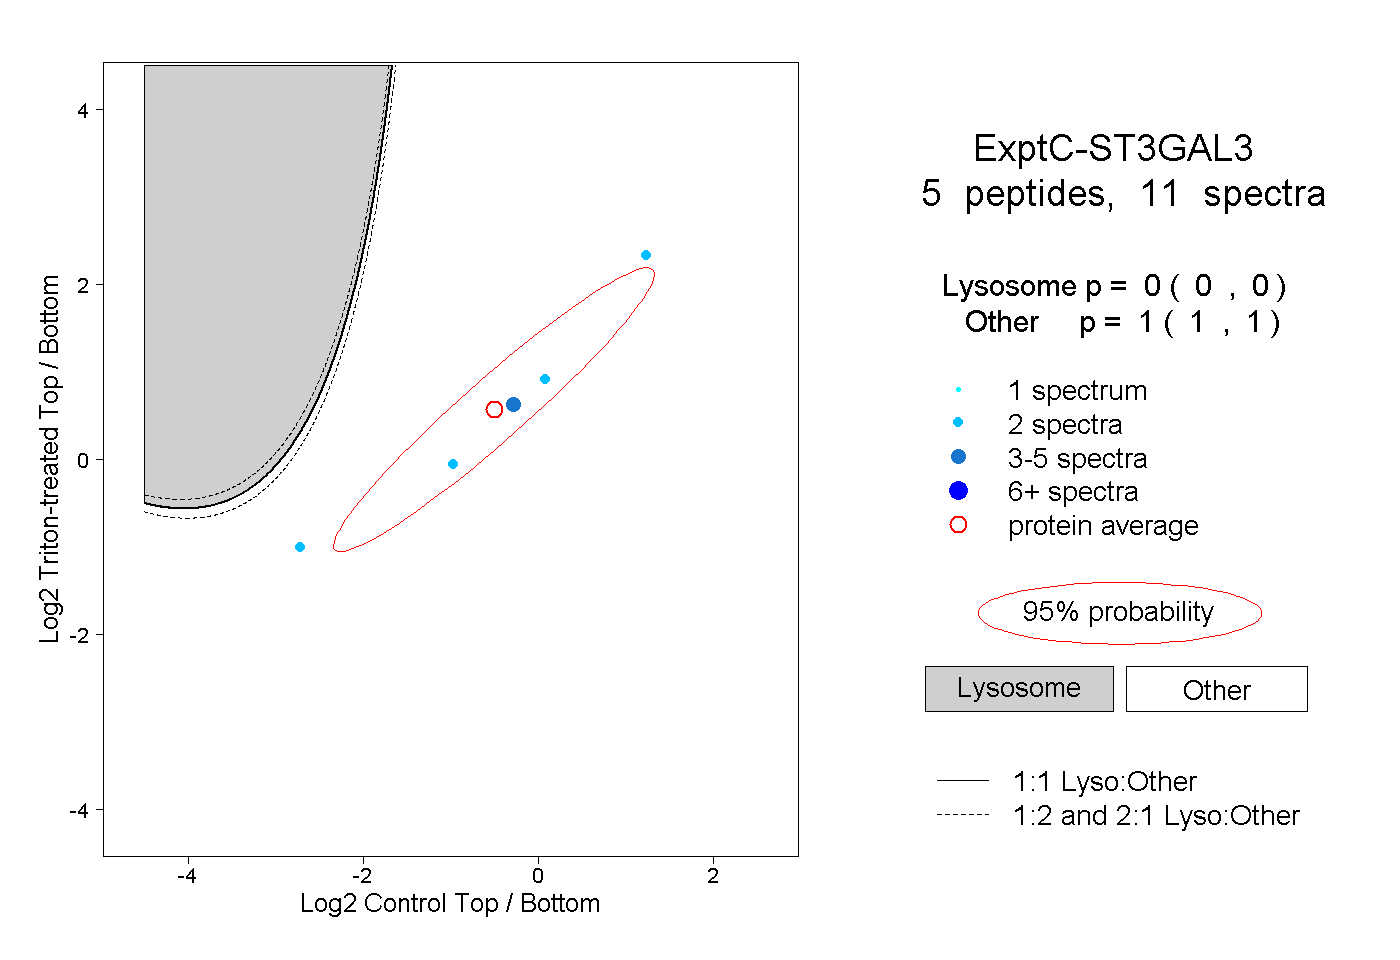
| Plot | Lyso | Other | |||||||||||
| Expt C |
5 peptides |
11 spectra |
|
0.000 0.000 | 0.000 |
1.000 1.000 | 1.000 |