 6
6peptides
spectra
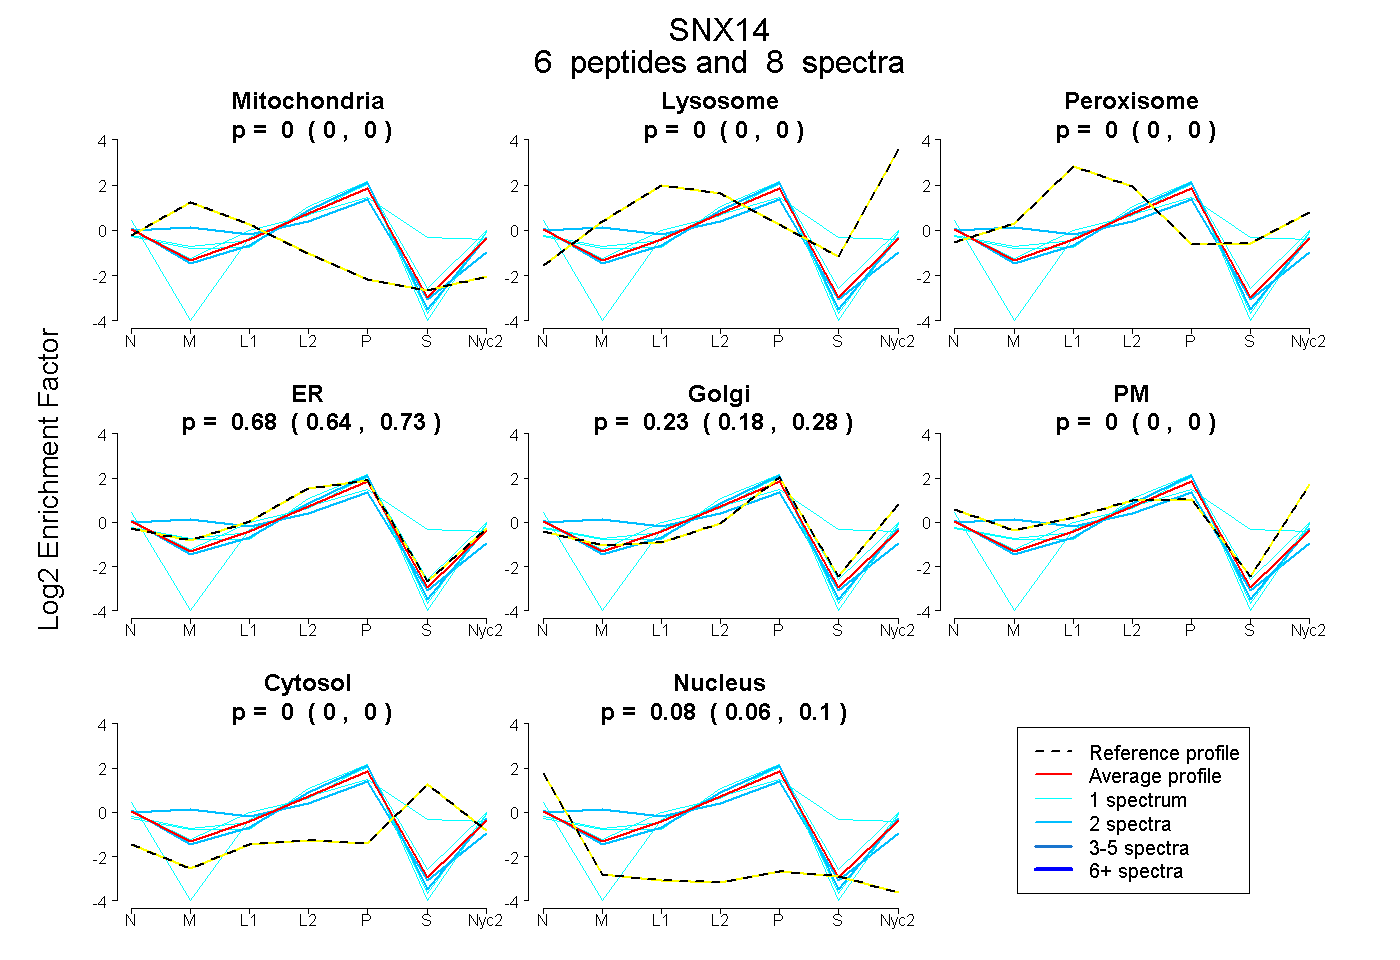
0.000 | 0.000
0.000 | 0.000
0.000 | 0.000
0.636 | 0.728
0.177 | 0.276
0.000 | 0.000
0.000 | 0.000
0.065 | 0.097
| Plot | Mito | Lyso | Perox | ER | Golgi | PM | Cytosol | Nucleus | |||||
| Expt A |
6 peptides |
8 spectra |
|
0.000 0.000 | 0.000 |
0.000 0.000 | 0.000 |
0.000 0.000 | 0.000 |
0.685 0.636 | 0.728 |
0.232 0.177 | 0.276 |
0.000 0.000 | 0.000 |
0.000 0.000 | 0.000 |
0.083 0.065 | 0.097 |
| 2 spectra, LFNDLFK | 0.000 | 0.000 | 0.000 | 0.674 | 0.256 | 0.000 | 0.000 | 0.071 | ||
| 1 spectrum, EEFQEYLQK | 0.000 | 0.000 | 0.000 | 0.555 | 0.000 | 0.000 | 0.445 | 0.000 | ||
| 1 spectrum, DAIFCENTEPR | 0.000 | 0.000 | 0.000 | 0.670 | 0.292 | 0.000 | 0.000 | 0.038 | ||
| 1 spectrum, LEQLFQEHR | 0.000 | 0.000 | 0.000 | 0.708 | 0.270 | 0.000 | 0.000 | 0.022 | ||
| 1 spectrum, FMNFIK | 0.006 | 0.000 | 0.000 | 0.615 | 0.370 | 0.000 | 0.000 | 0.009 | ||
| 2 spectra, FDPFIVEEIQR | 0.250 | 0.000 | 0.000 | 0.615 | 0.122 | 0.000 | 0.000 | 0.014 |
| Plot | Lyso | Other | |||||||||||
| Expt C |
2 peptides |
8 spectra |
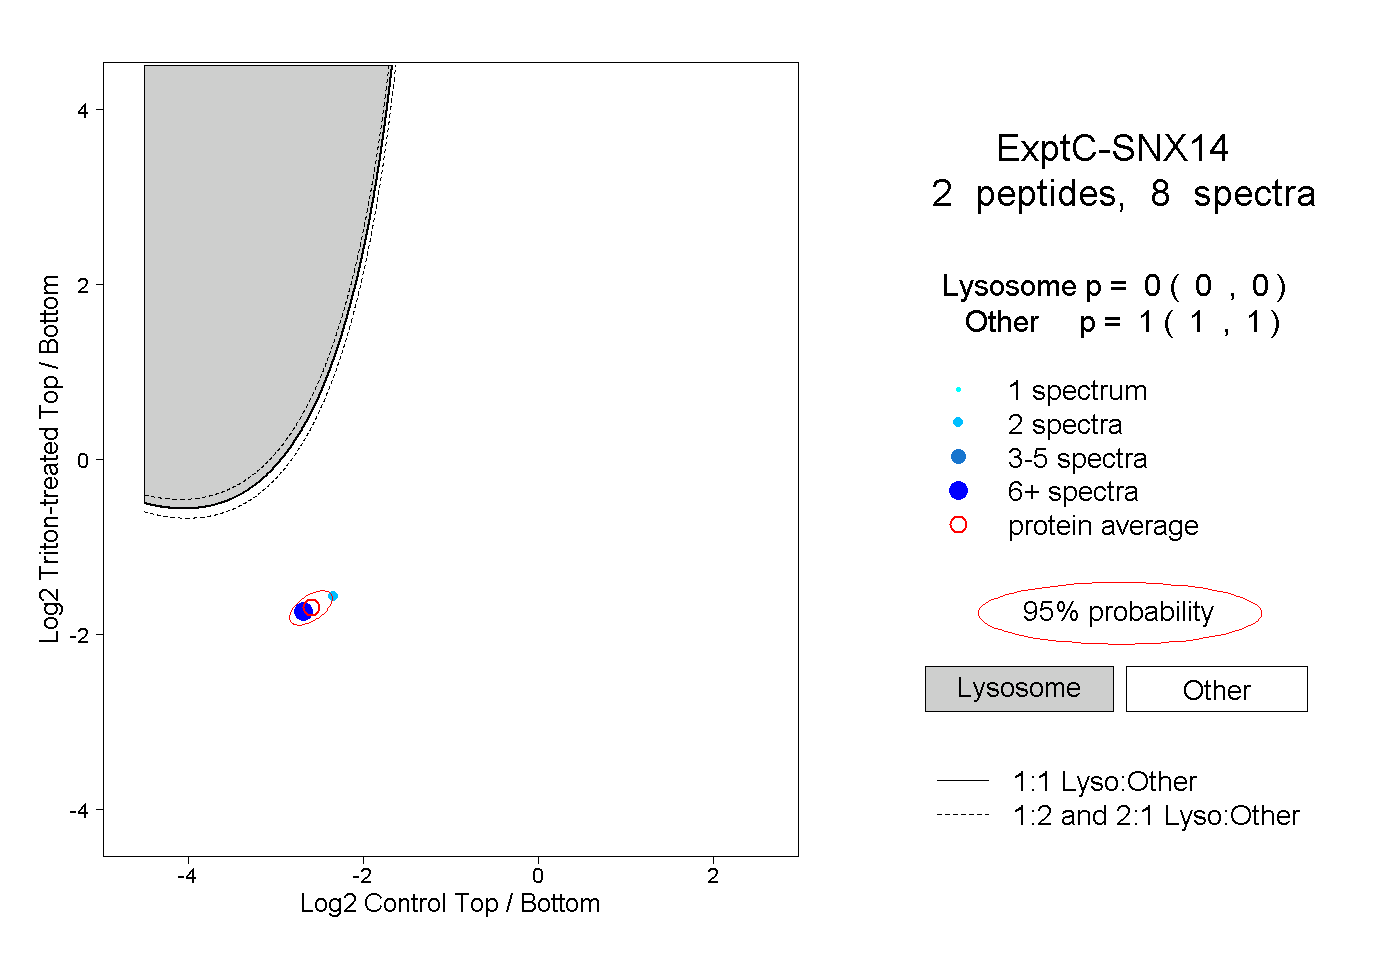 |
0.000 0.000 | 0.000 |
1.000 1.000 | 1.000 |