 3
3peptides
spectra
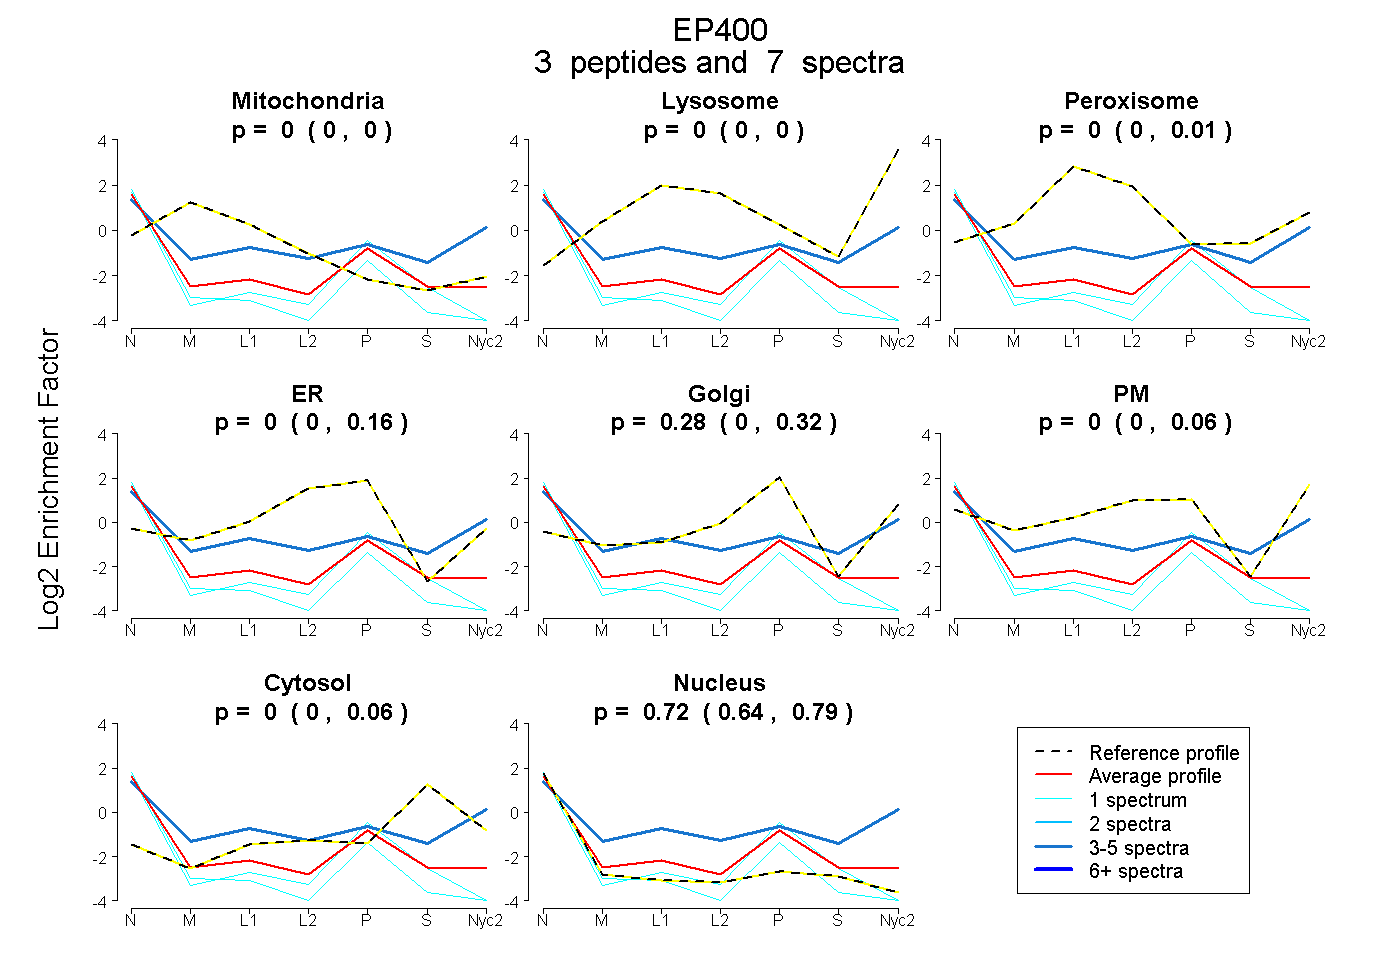
0.000 | 0.000
0.000 | 0.000
0.000 | 0.010
0.000 | 0.163
0.000 | 0.316
0.000 | 0.060
0.000 | 0.057
0.640 | 0.791
1peptide
spectra
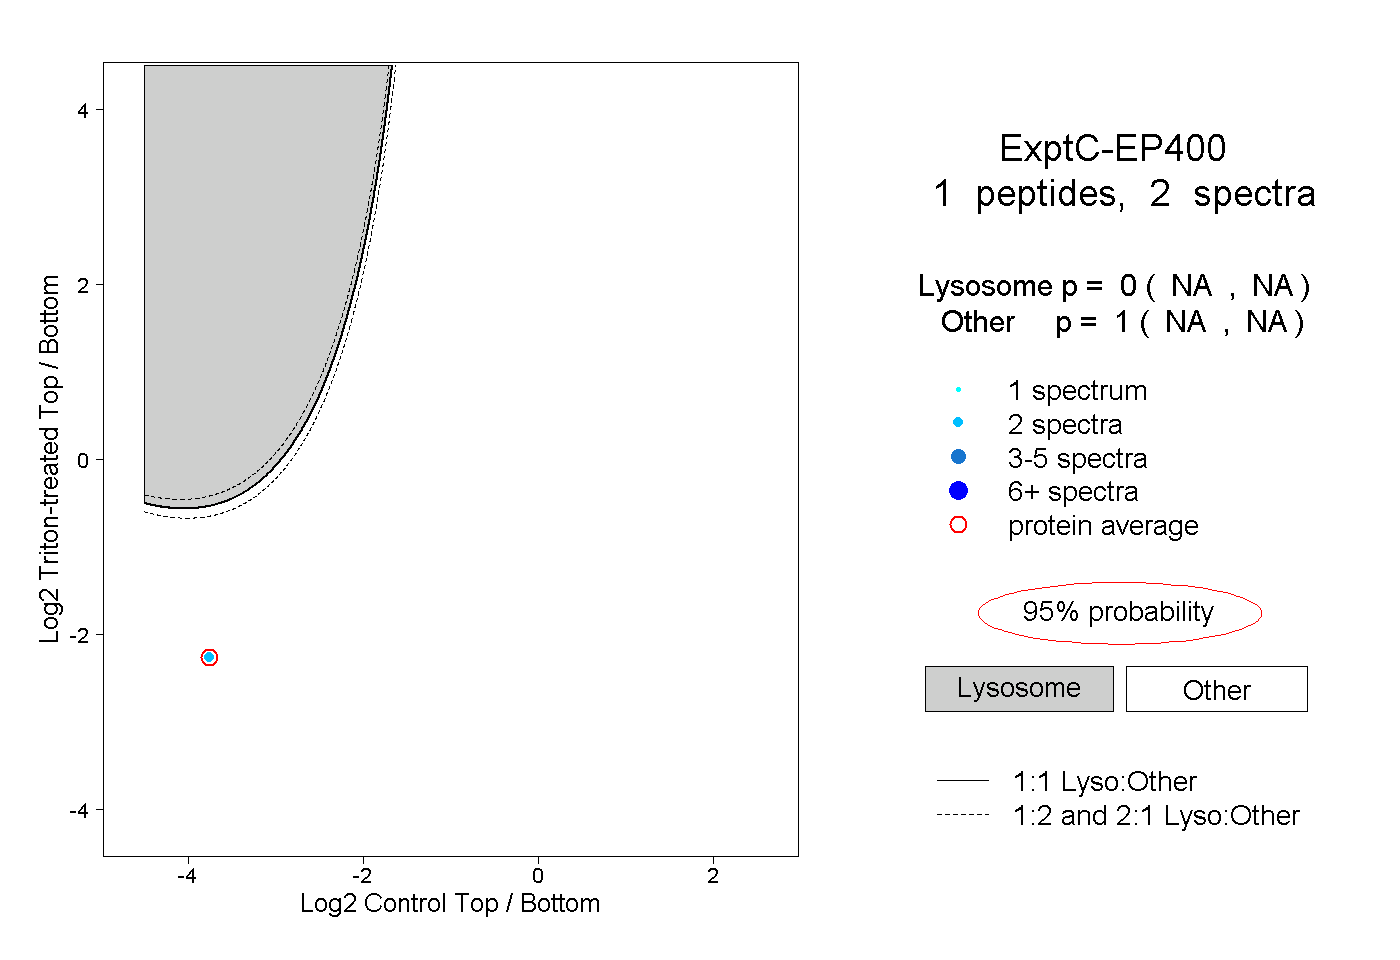
NA | NA
NA | NA
| Plot | Mito | Lyso | Perox | ER | Golgi | PM | Cytosol | Nucleus | |||||
| Expt A |
3 peptides |
7 spectra |
|
0.000 0.000 | 0.000 |
0.000 0.000 | 0.000 |
0.000 0.000 | 0.010 |
0.000 0.000 | 0.163 |
0.276 0.000 | 0.316 |
0.000 0.000 | 0.060 |
0.000 0.000 | 0.057 |
0.724 0.640 | 0.791 |
||
| Plot | Lyso | Other | |||||||||||
| Expt C |
1 peptide |
2 spectra |
|
0.000 NA | NA |
1.000 NA | NA |