 7
7peptides
spectra
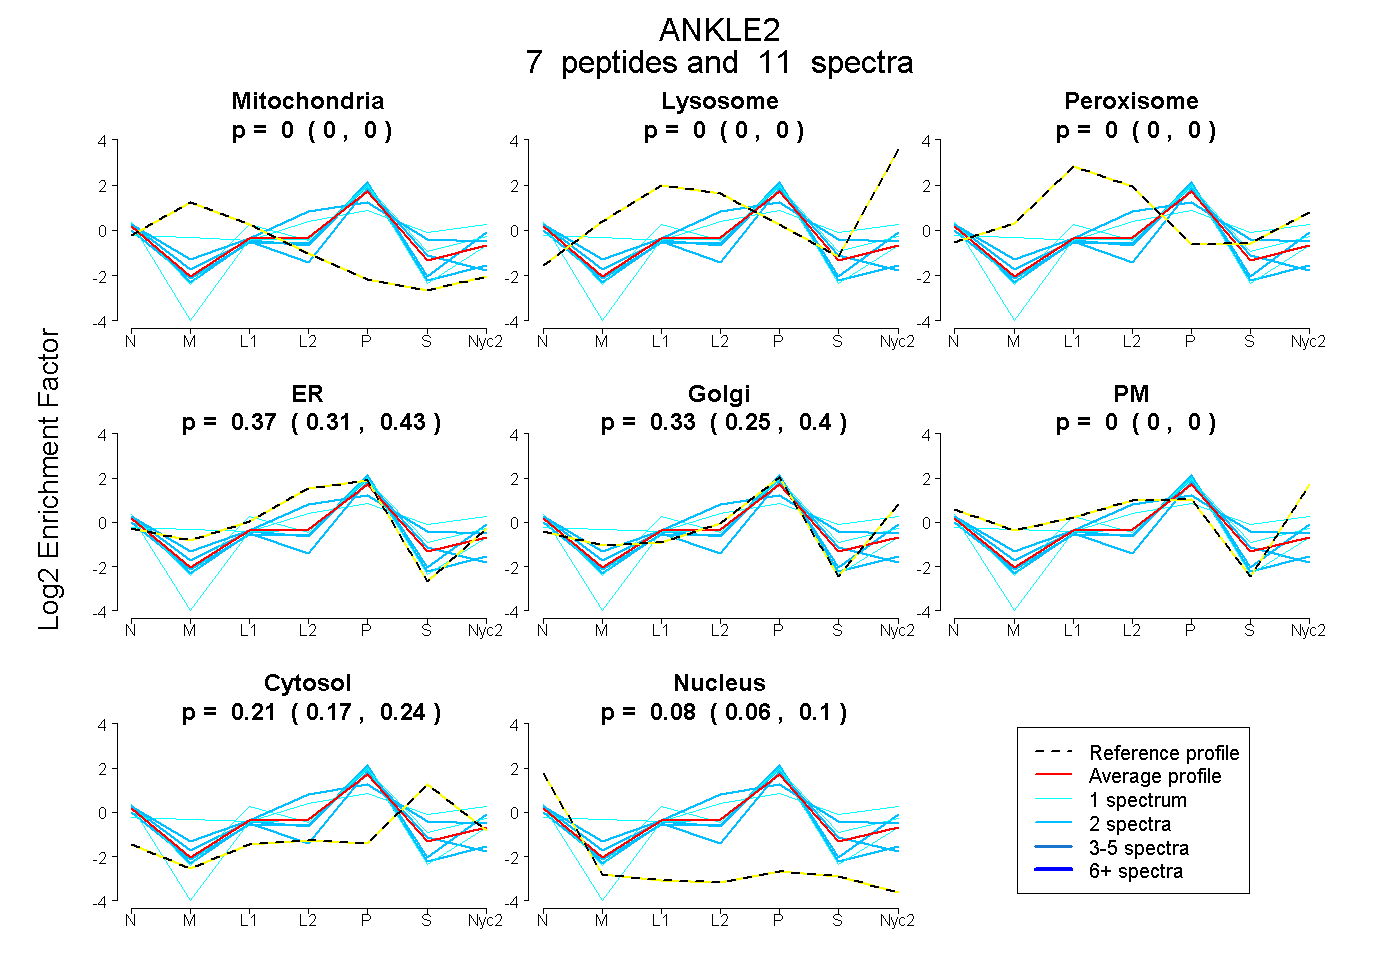
0.000 | 0.000
0.000 | 0.000
0.000 | 0.000
0.305 | 0.434
0.254 | 0.400
0.000 | 0.000
0.173 | 0.243
0.058 | 0.102
1peptide
spectrum
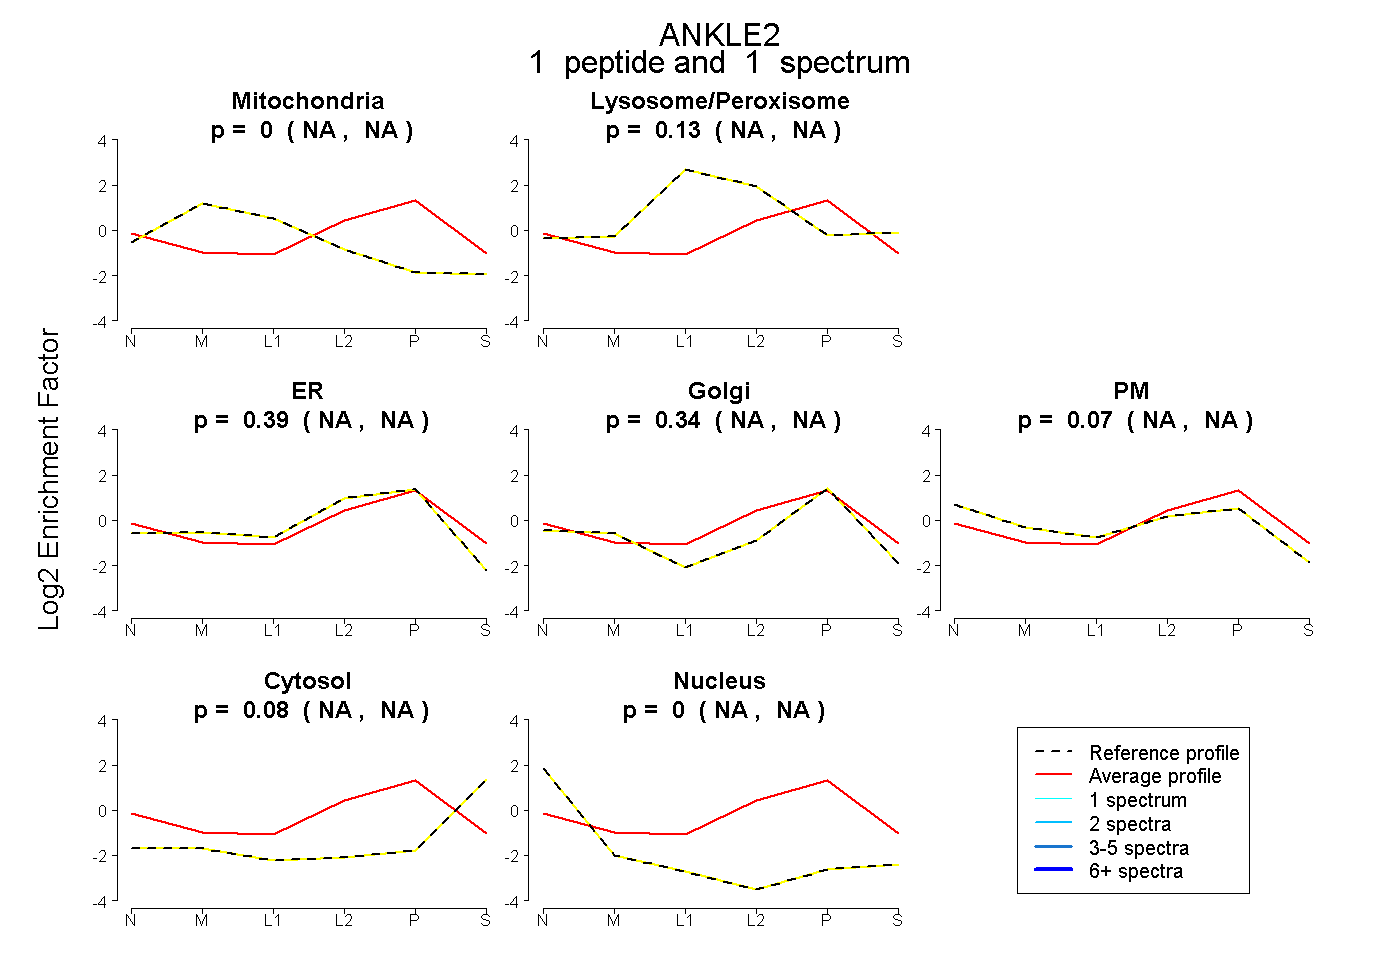
NA | NA
NA | NA
NA | NA
NA | NA
NA | NA
NA | NA
NA | NA
3peptides
spectra
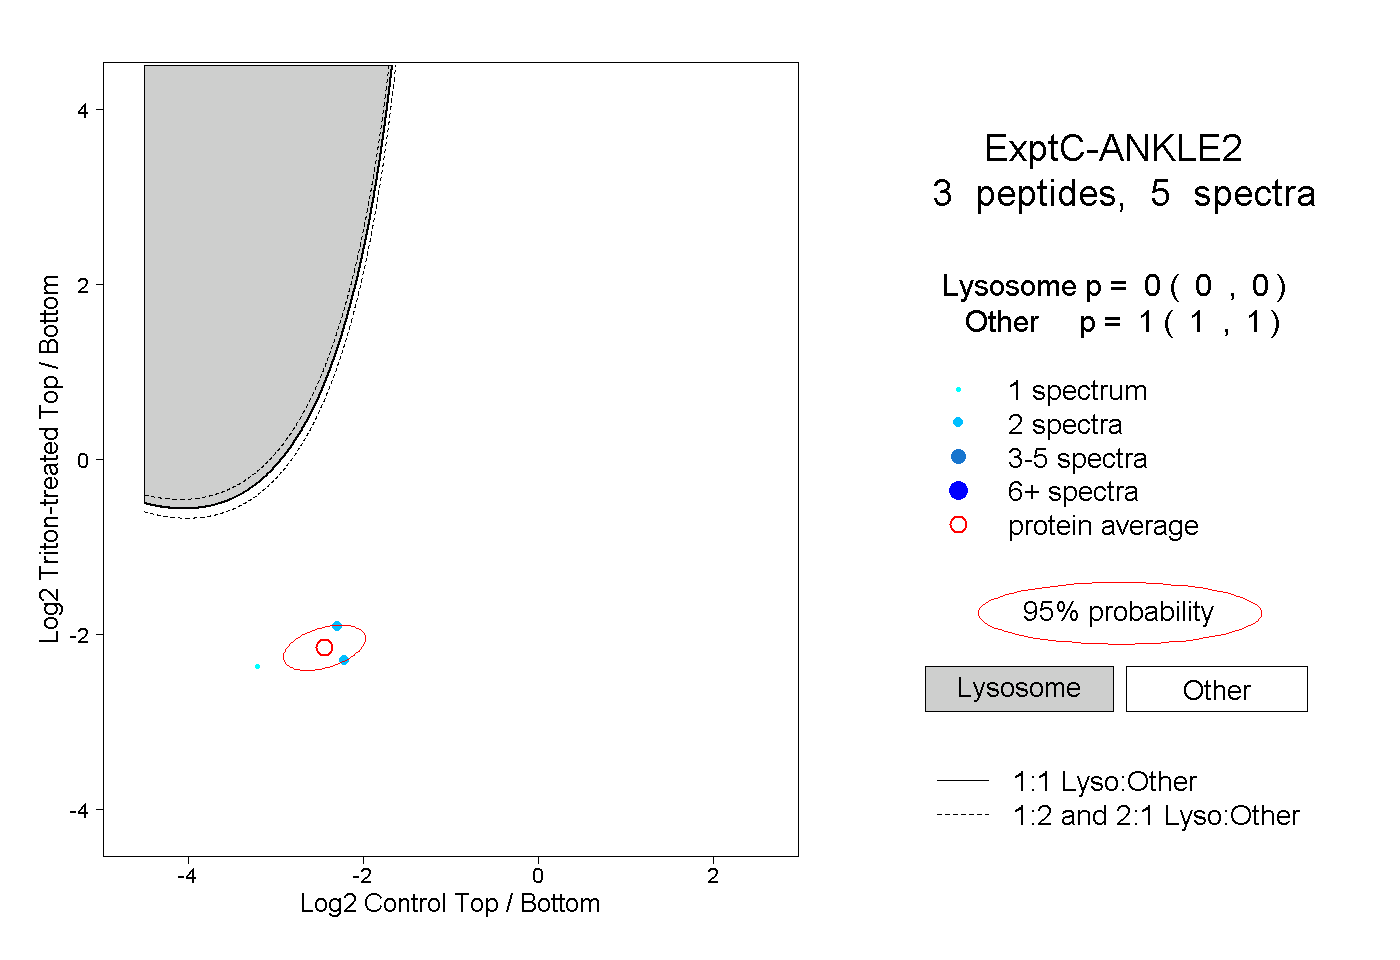
0.000 | 0.000
1.000 | 1.000