16
16peptides
spectra
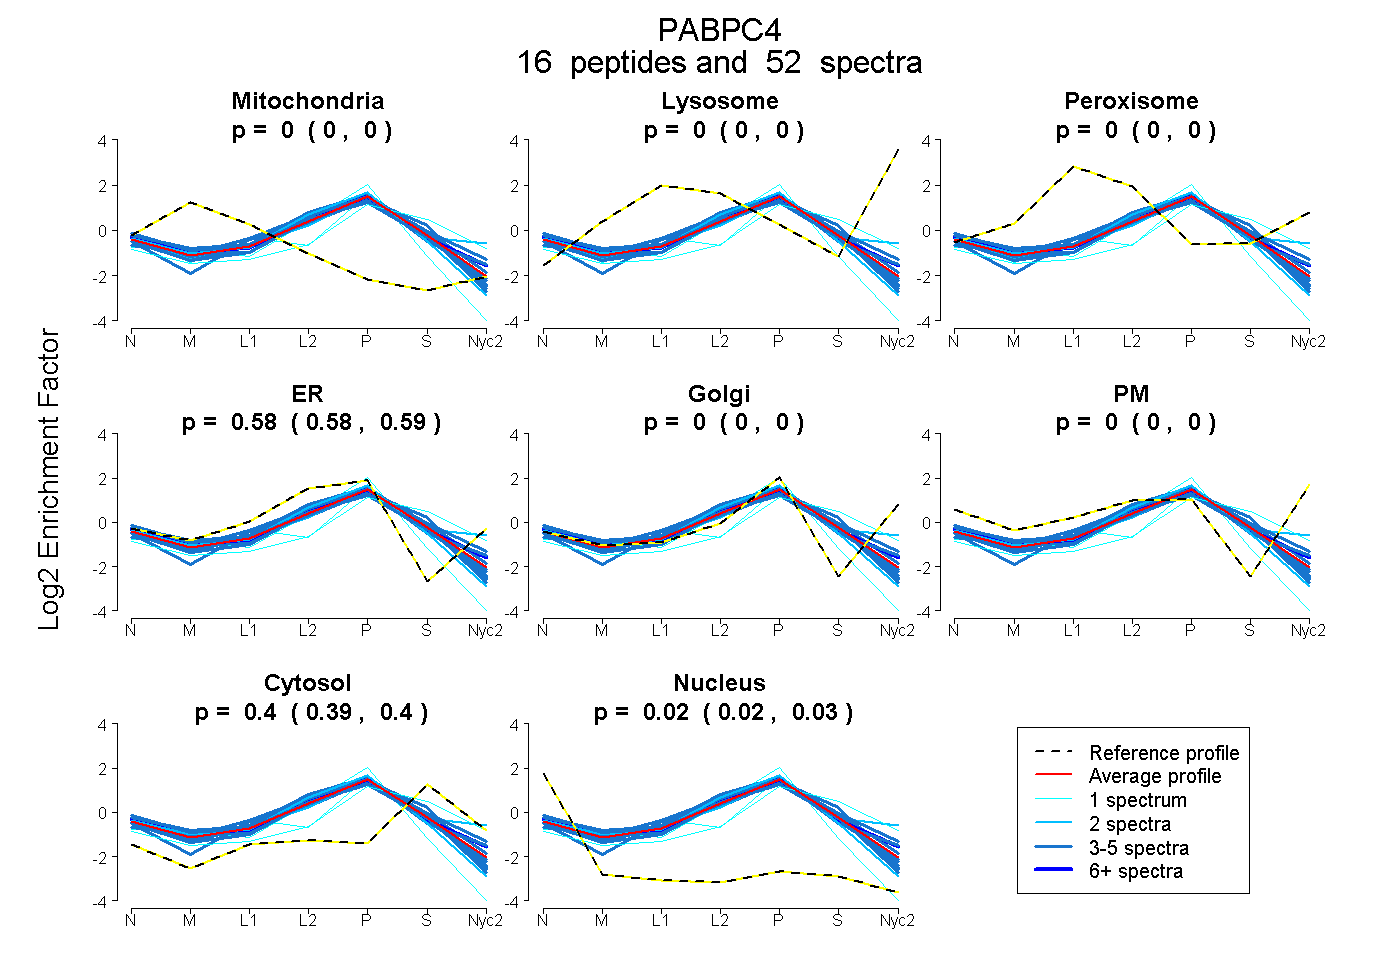
0.000 | 0.000
0.000 | 0.000
0.000 | 0.000
0.579 | 0.585
0.000 | 0.000
0.000 | 0.000
0.391 | 0.398
0.019 | 0.025
9peptides
spectra
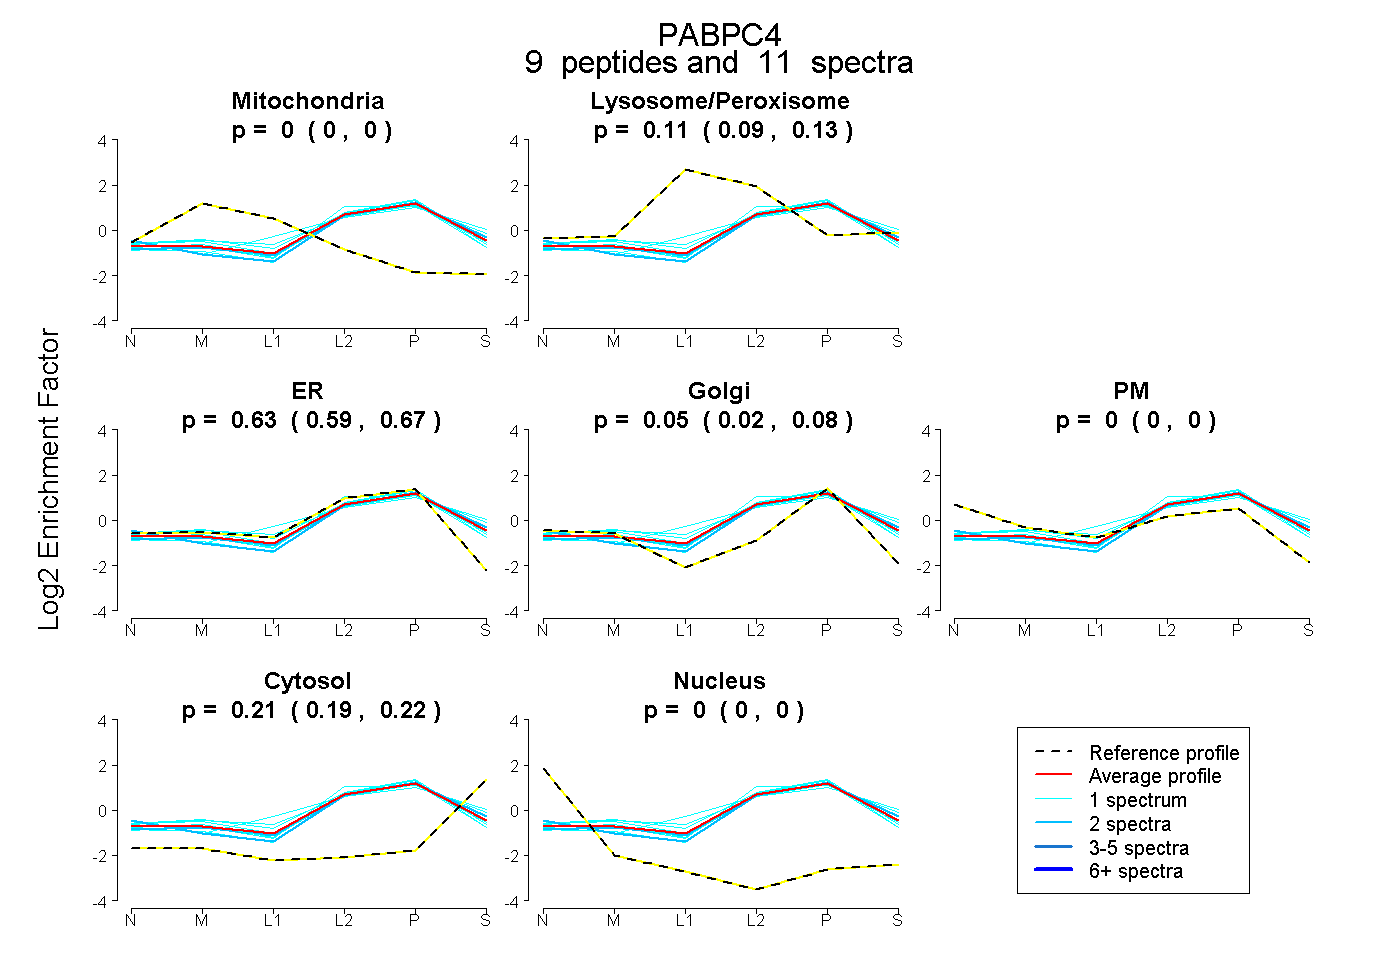
0.000 | 0.000
0.091 | 0.132
0.587 | 0.666
0.017 | 0.079
0.000 | 0.000
0.193 | 0.217
0.000 | 0.000