 1
1peptide
spectra
0.000 | 0.052
0.000 | 0.000
0.000 | 0.184
0.476 | 0.801
0.000 | 0.000
0.000 | 0.000
0.118 | 0.343
0.000 | 0.051
1peptide
spectra
NA | NA
NA | NA
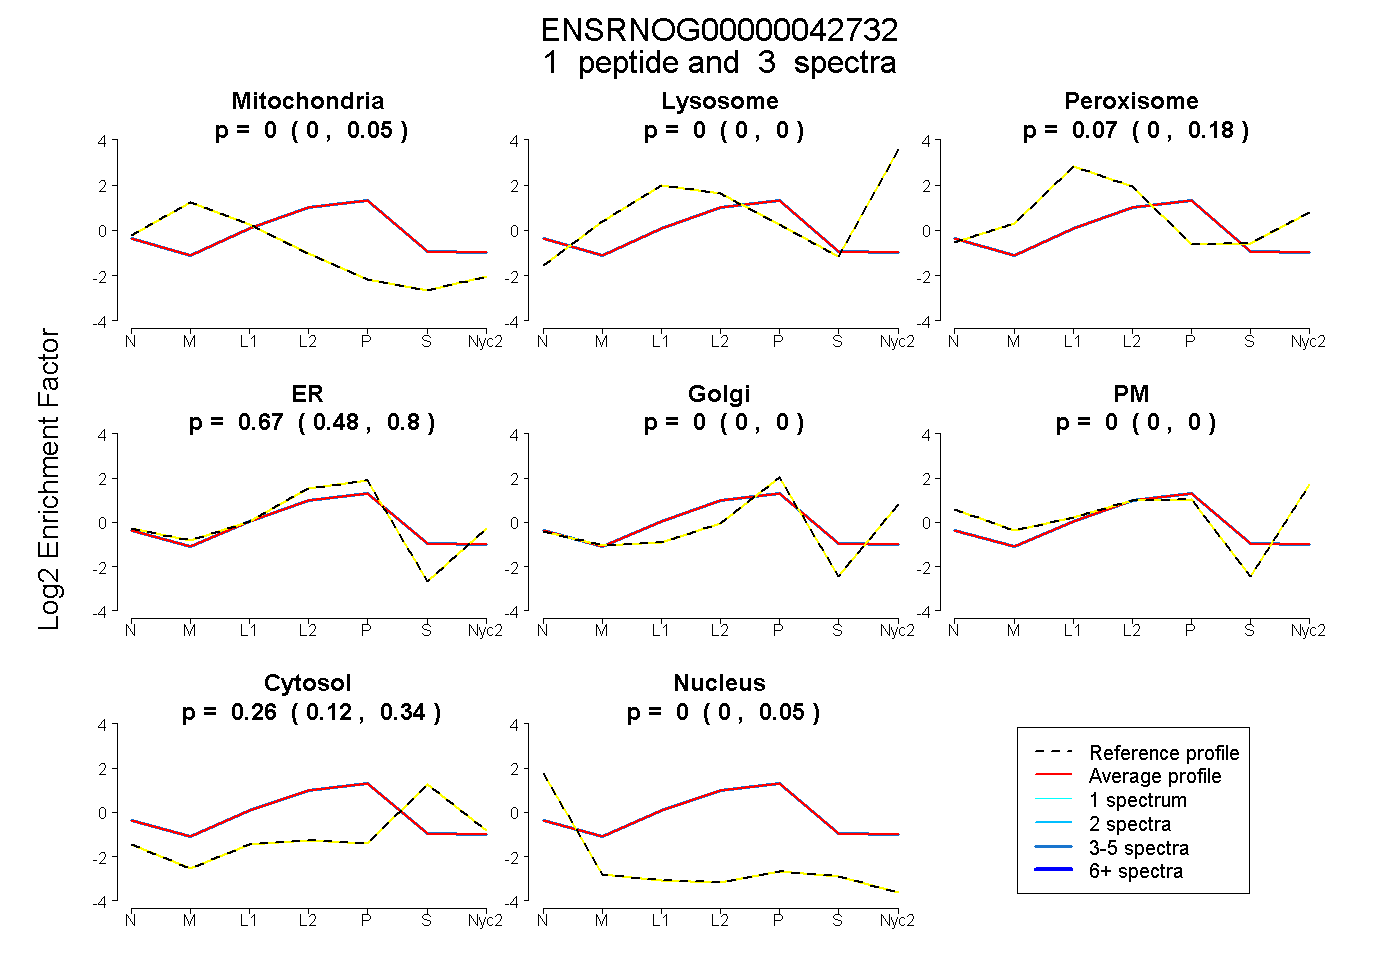
| Plot | Mito | Lyso | Perox | ER | Golgi | PM | Cytosol | Nucleus | |||||
| Expt A |
1 peptide |
3 spectra |
|
0.000 0.000 | 0.052 |
0.000 0.000 | 0.000 |
0.071 0.000 | 0.184 |
0.671 0.476 | 0.801 |
0.000 0.000 | 0.000 |
0.000 0.000 | 0.000 |
0.258 0.118 | 0.343 |
0.000 0.000 | 0.051 |
||
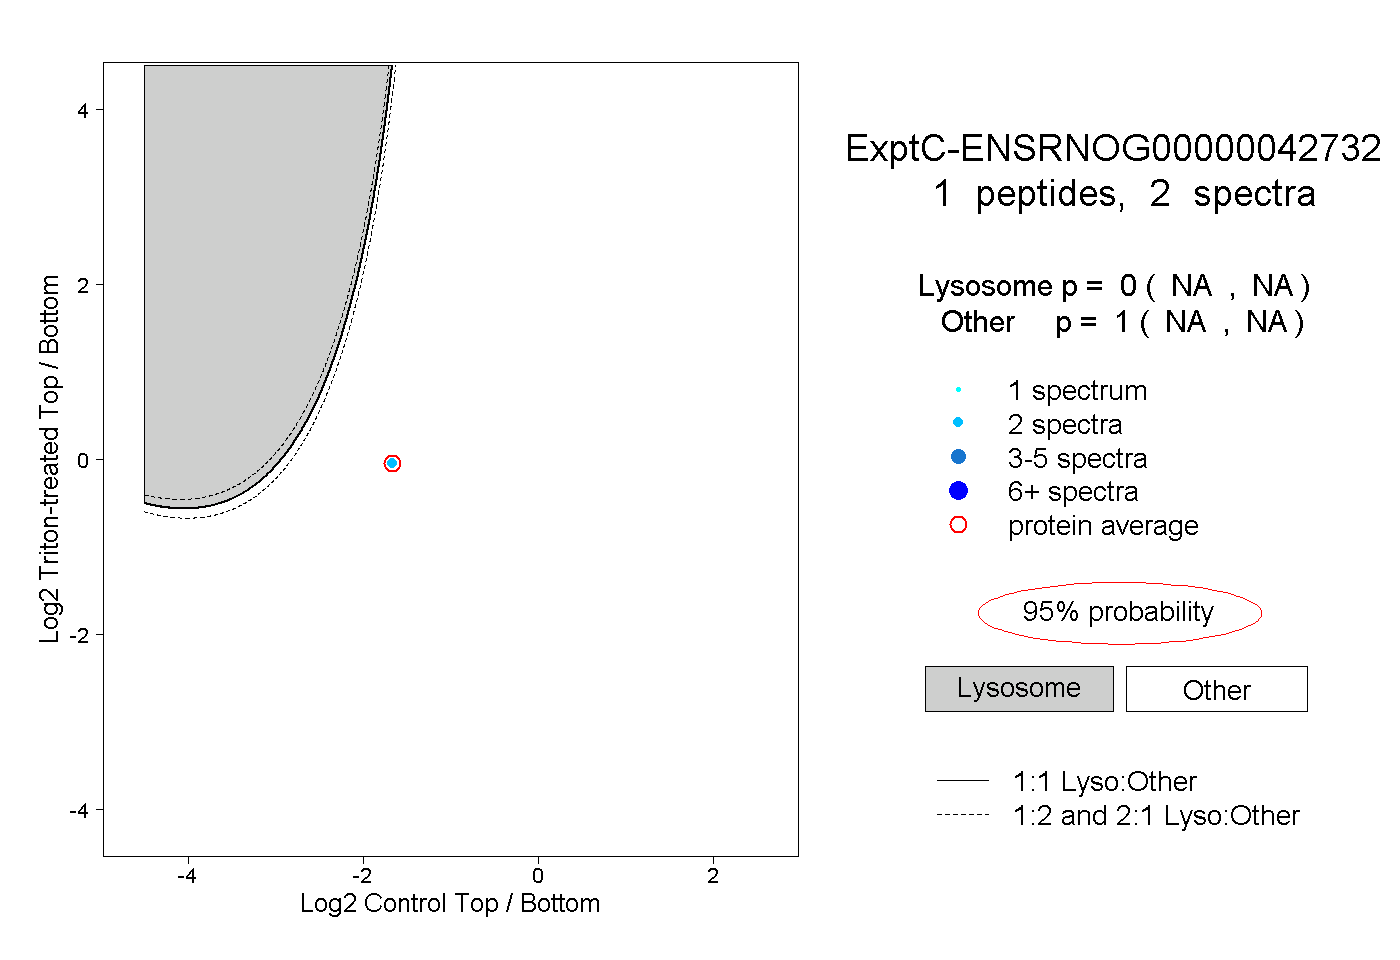
| Plot | Lyso | Other | |||||||||||
| Expt C |
1 peptide |
2 spectra |
|
0.000 NA | NA |
1.000 NA | NA |