 3
3peptides
spectra
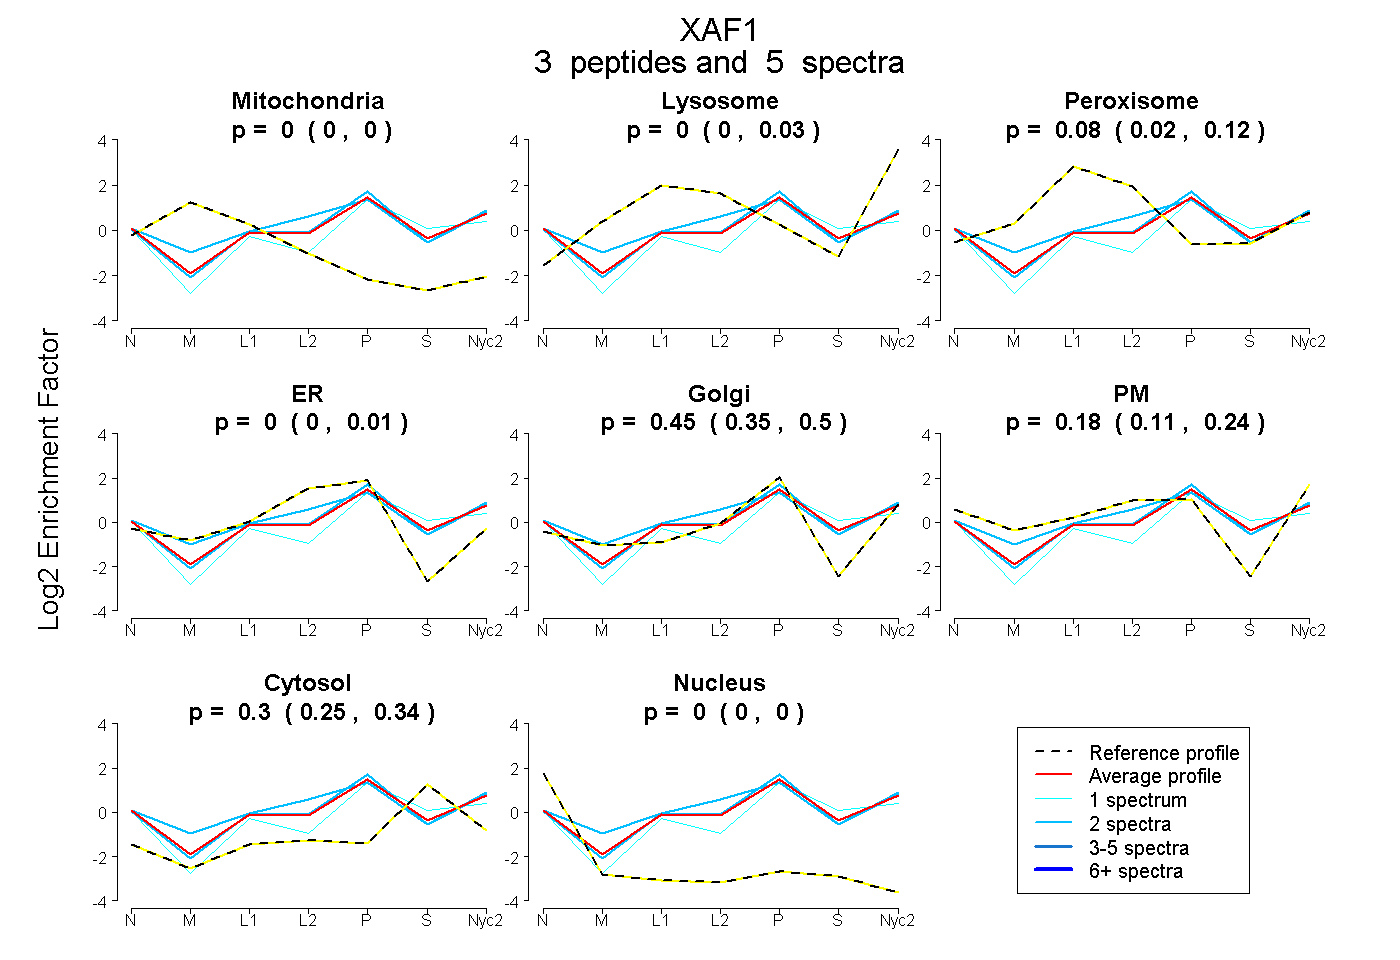
0.000 | 0.000
0.000 | 0.027
0.015 | 0.123
0.000 | 0.006
0.350 | 0.504
0.106 | 0.235
0.254 | 0.340
0.000 | 0.000
1peptide
spectra
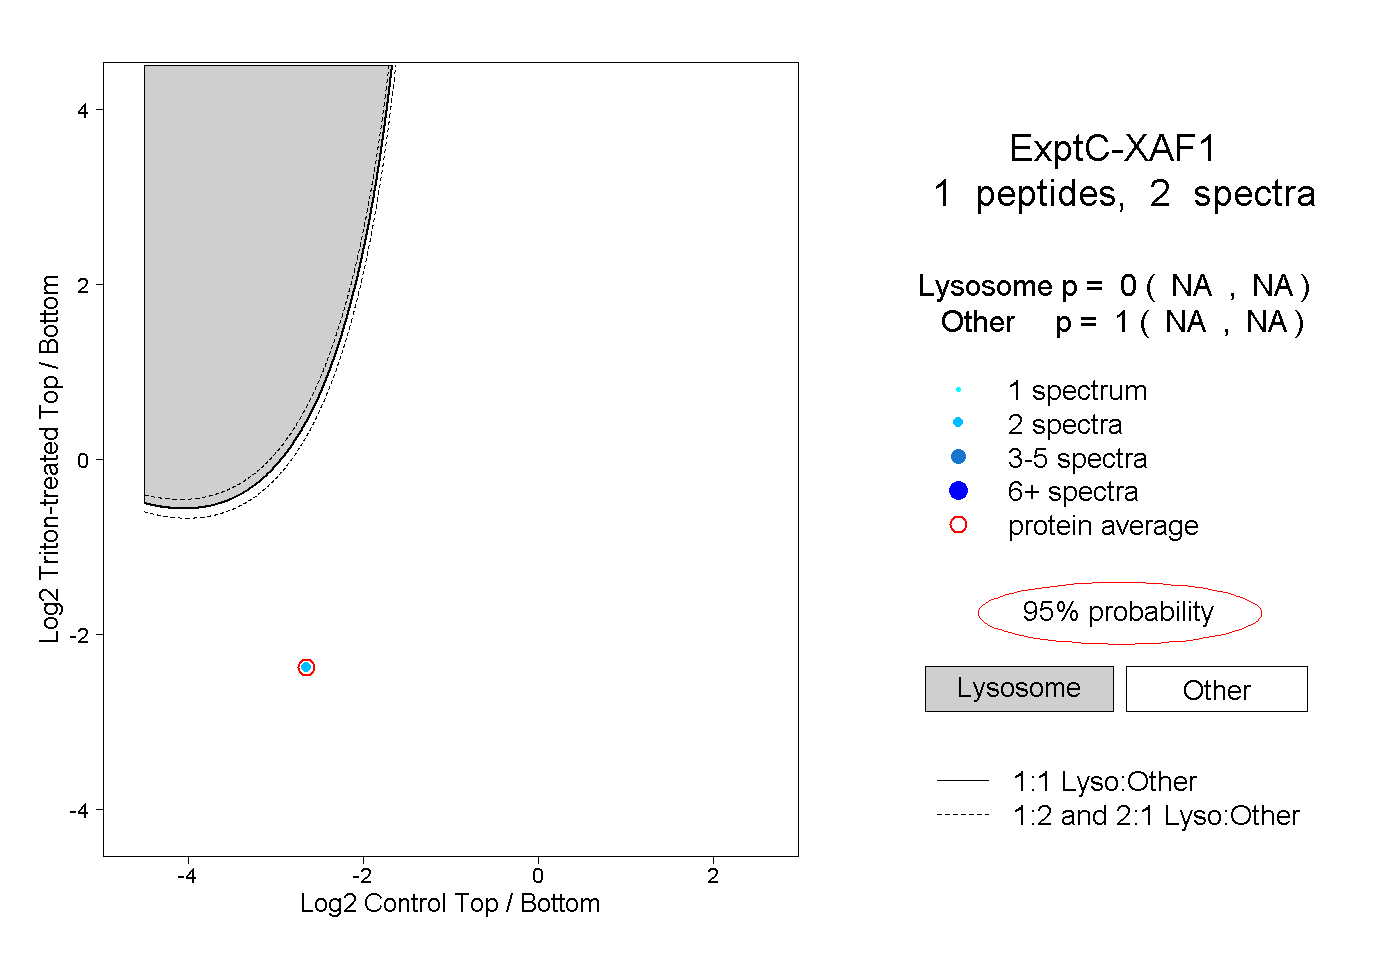
NA | NA
NA | NA
2peptides
spectra
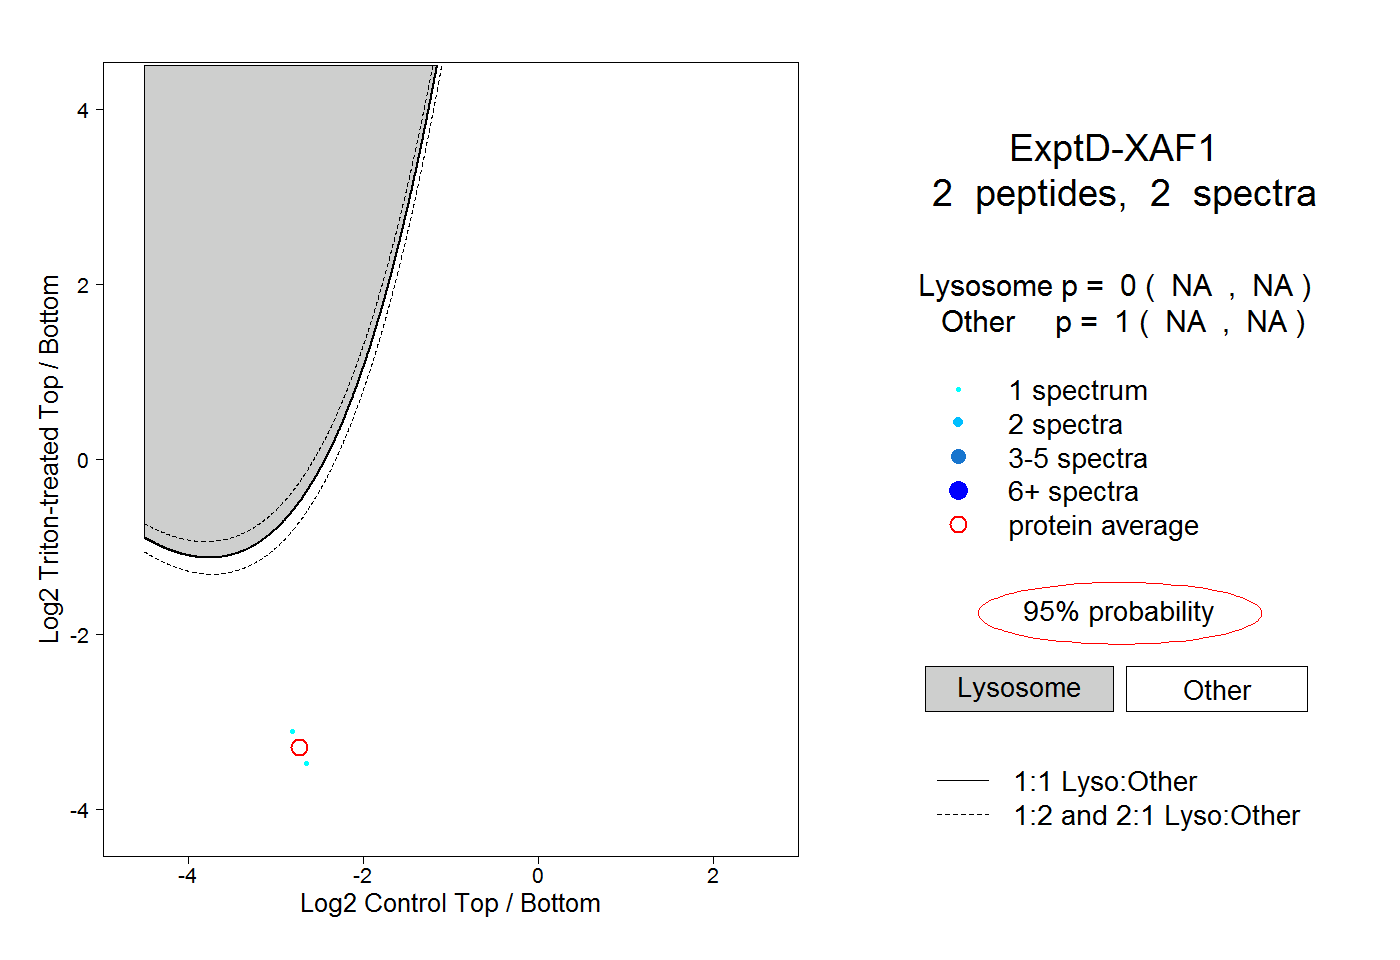
NA | NA
NA | NA