 2
2peptides
spectra
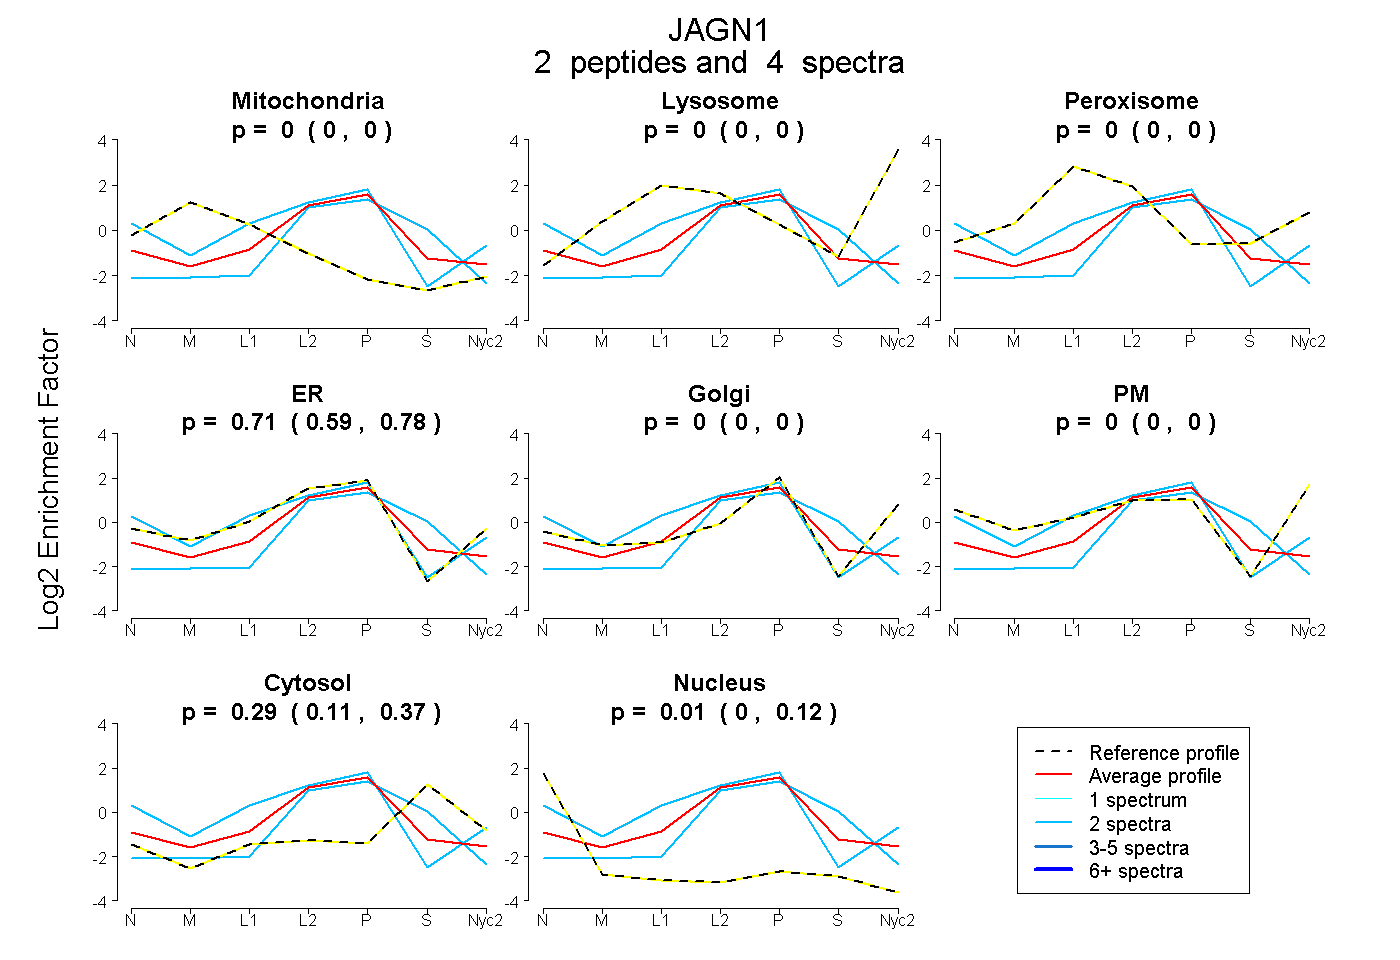
0.000 | 0.000
0.000 | 0.000
0.000 | 0.000
0.592 | 0.781
0.000 | 0.000
0.000 | 0.000
0.107 | 0.370
0.000 | 0.119
4peptides
spectra
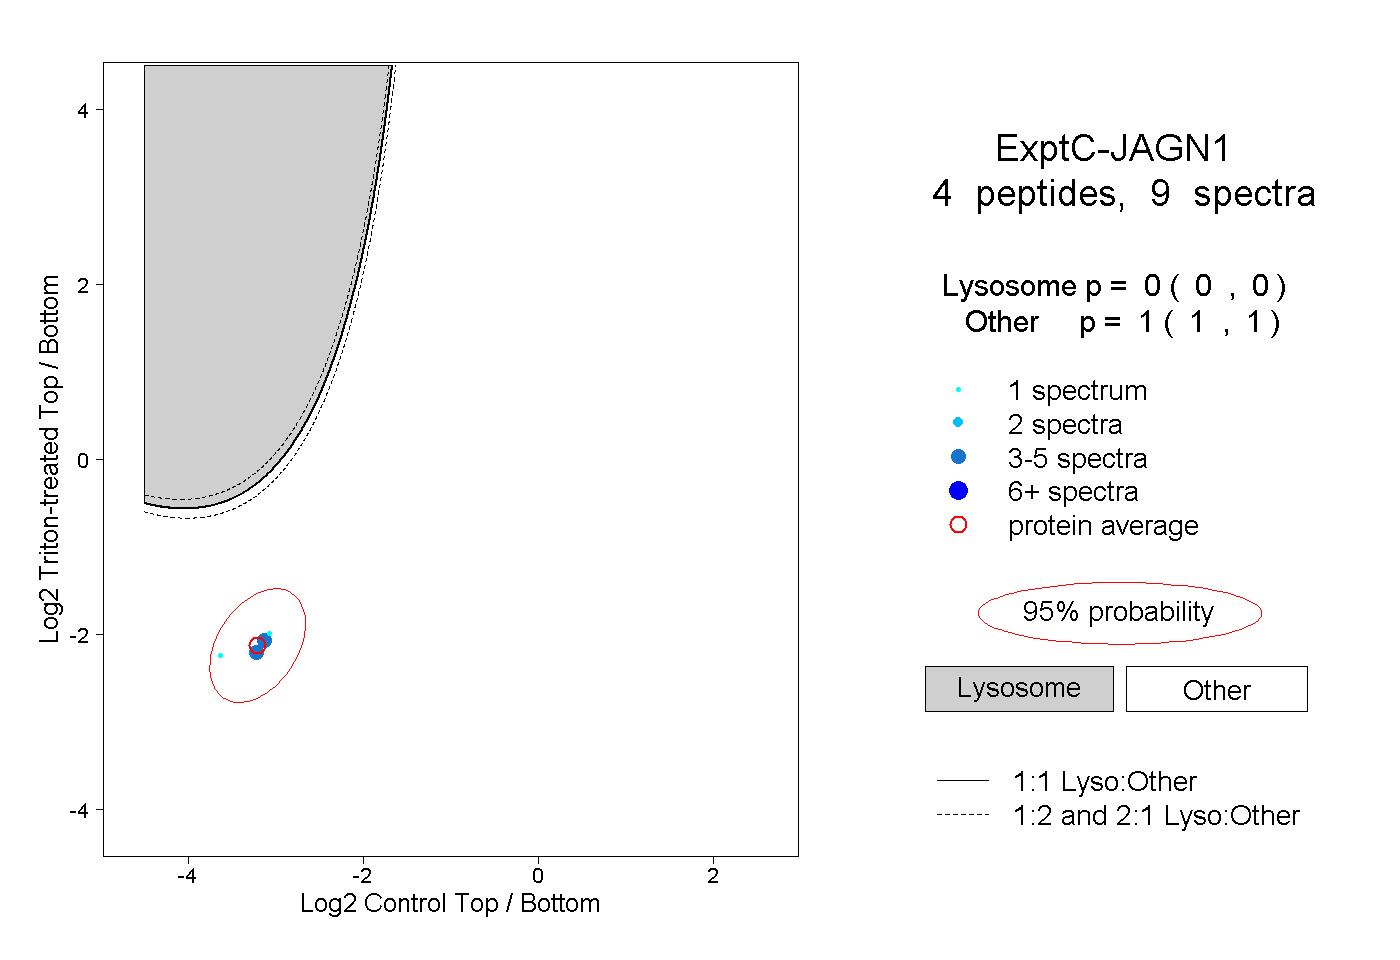
0.000 | 0.000
1.000 | 1.000
| Plot | Mito | Lyso | Perox | ER | Golgi | PM | Cytosol | Nucleus | |||||
| Expt A |
2 peptides |
4 spectra |
|
0.000 0.000 | 0.000 |
0.000 0.000 | 0.000 |
0.000 0.000 | 0.000 |
0.707 0.592 | 0.781 |
0.000 0.000 | 0.000 |
0.000 0.000 | 0.000 |
0.286 0.107 | 0.370 |
0.008 0.000 | 0.119 |
||
| Plot | Lyso | Other | |||||||||||
| Expt C |
4 peptides |
9 spectra |
|
0.000 0.000 | 0.000 |
1.000 1.000 | 1.000 |
| 3 spectra, MSVGHLR | 0.000 | 1.000 | ||||||||
| 1 spectrum, LLDSWFTSTQEK | 0.000 | 1.000 | ||||||||
| 4 spectra, AAGTDGSDFQHR | 0.000 | 1.000 | ||||||||
| 1 spectrum, VAMHYQMSVTLK | 0.000 | 1.000 |