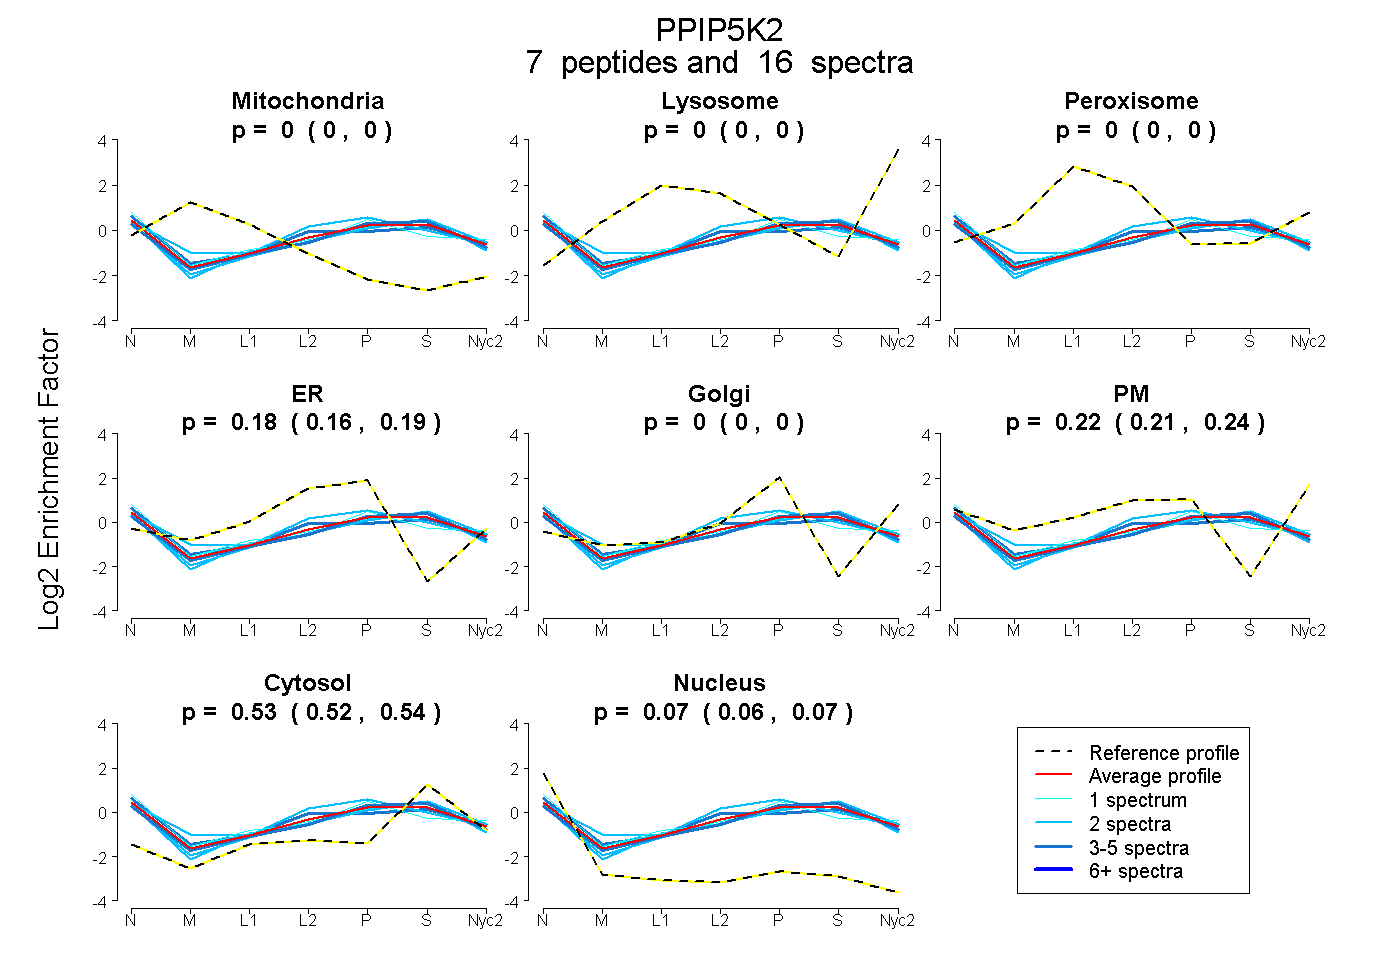
 7
7peptides
spectra
0.000 | 0.000
0.000 | 0.000
0.000 | 0.000
0.160 | 0.191
0.000 | 0.000
0.209 | 0.238
0.520 | 0.539
0.061 | 0.074
| Plot | Mito | Lyso | Perox | ER | Golgi | PM | Cytosol | Nucleus | |||||
| Expt A |
7 peptides |
16 spectra |
|
0.000 0.000 | 0.000 |
0.000 0.000 | 0.000 |
0.000 0.000 | 0.000 |
0.177 0.160 | 0.191 |
0.000 0.000 | 0.000 |
0.225 0.209 | 0.238 |
0.530 0.520 | 0.539 |
0.068 0.061 | 0.074 |
| 1 spectrum, VYTVGPDYAHAEAR | 0.000 | 0.000 | 0.000 | 0.080 | 0.056 | 0.356 | 0.394 | 0.114 | ||
| 5 spectra, FFDLFEK | 0.000 | 0.000 | 0.018 | 0.108 | 0.000 | 0.303 | 0.488 | 0.084 | ||
| 2 spectra, SSVYSPESSVR | 0.000 | 0.000 | 0.000 | 0.102 | 0.000 | 0.236 | 0.603 | 0.059 | ||
| 3 spectra, YPVILNAR | 0.000 | 0.000 | 0.000 | 0.197 | 0.028 | 0.141 | 0.575 | 0.058 | ||
| 2 spectra, ILGNIVMR | 0.000 | 0.000 | 0.000 | 0.322 | 0.000 | 0.194 | 0.447 | 0.037 | ||
| 2 spectra, DVYSILQAEGILLPR | 0.000 | 0.000 | 0.000 | 0.224 | 0.000 | 0.106 | 0.597 | 0.074 | ||
| 1 spectrum, GFPLDK | 0.000 | 0.000 | 0.004 | 0.174 | 0.000 | 0.193 | 0.580 | 0.050 |
| Plot | Mito | Lyso or Perox | ER | Golgi | PM | Cytosol | Nucleus | ||||||
| Expt B |
2 peptides |
2 spectra |
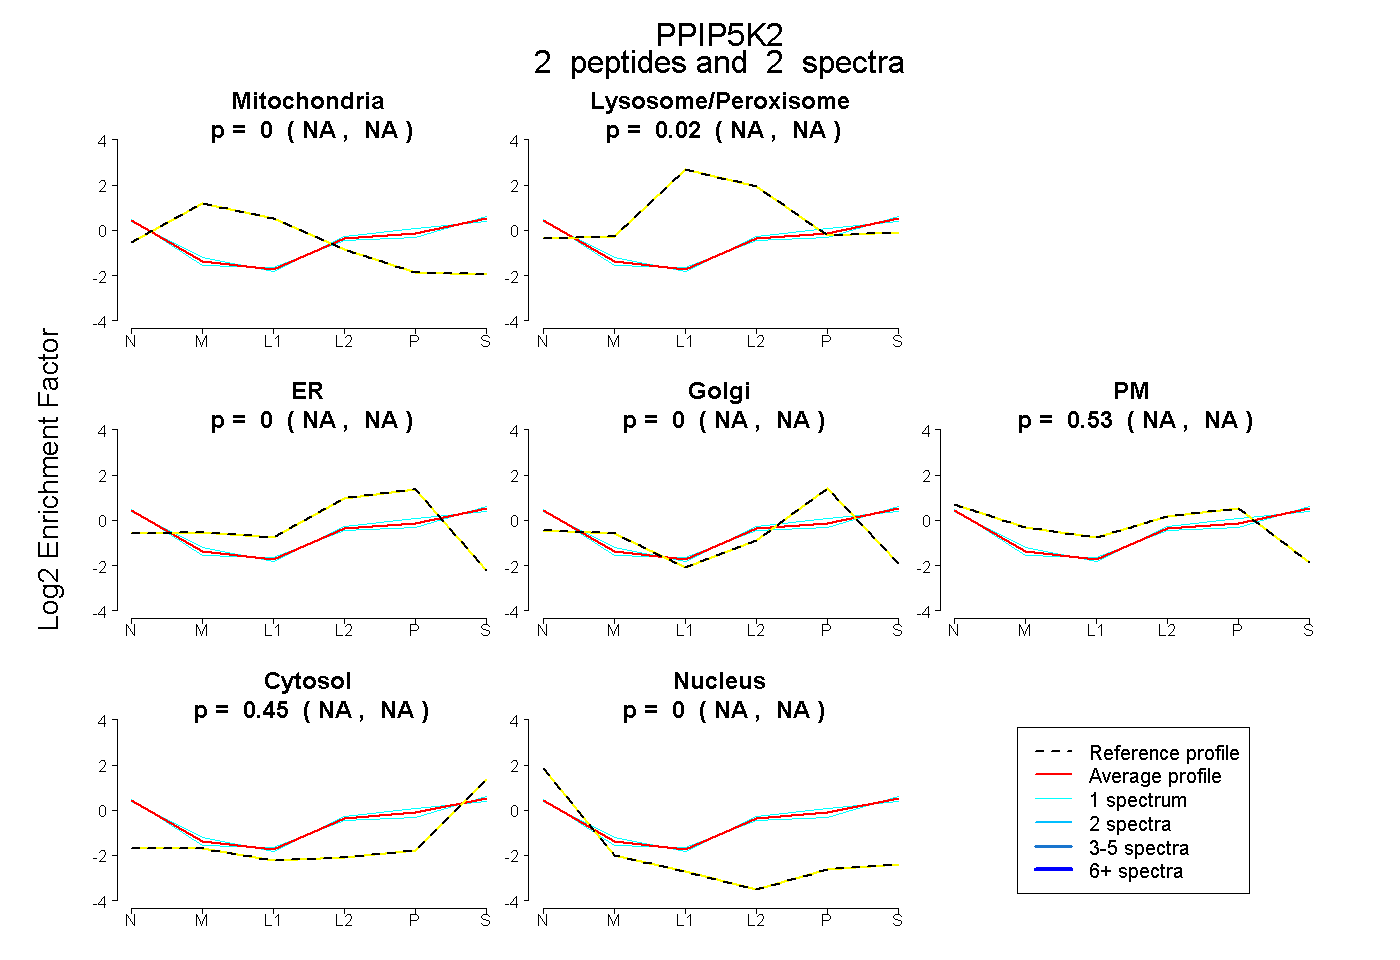 |
0.000 NA | NA |
0.015 NA | NA |
0.000 NA | NA |
0.000 NA | NA |
0.532 NA | NA |
0.453 NA | NA |
0.000 NA | NA |
|||
| Plot | Lyso | Other | |||||||||||
| Expt C |
4 peptides |
9 spectra |
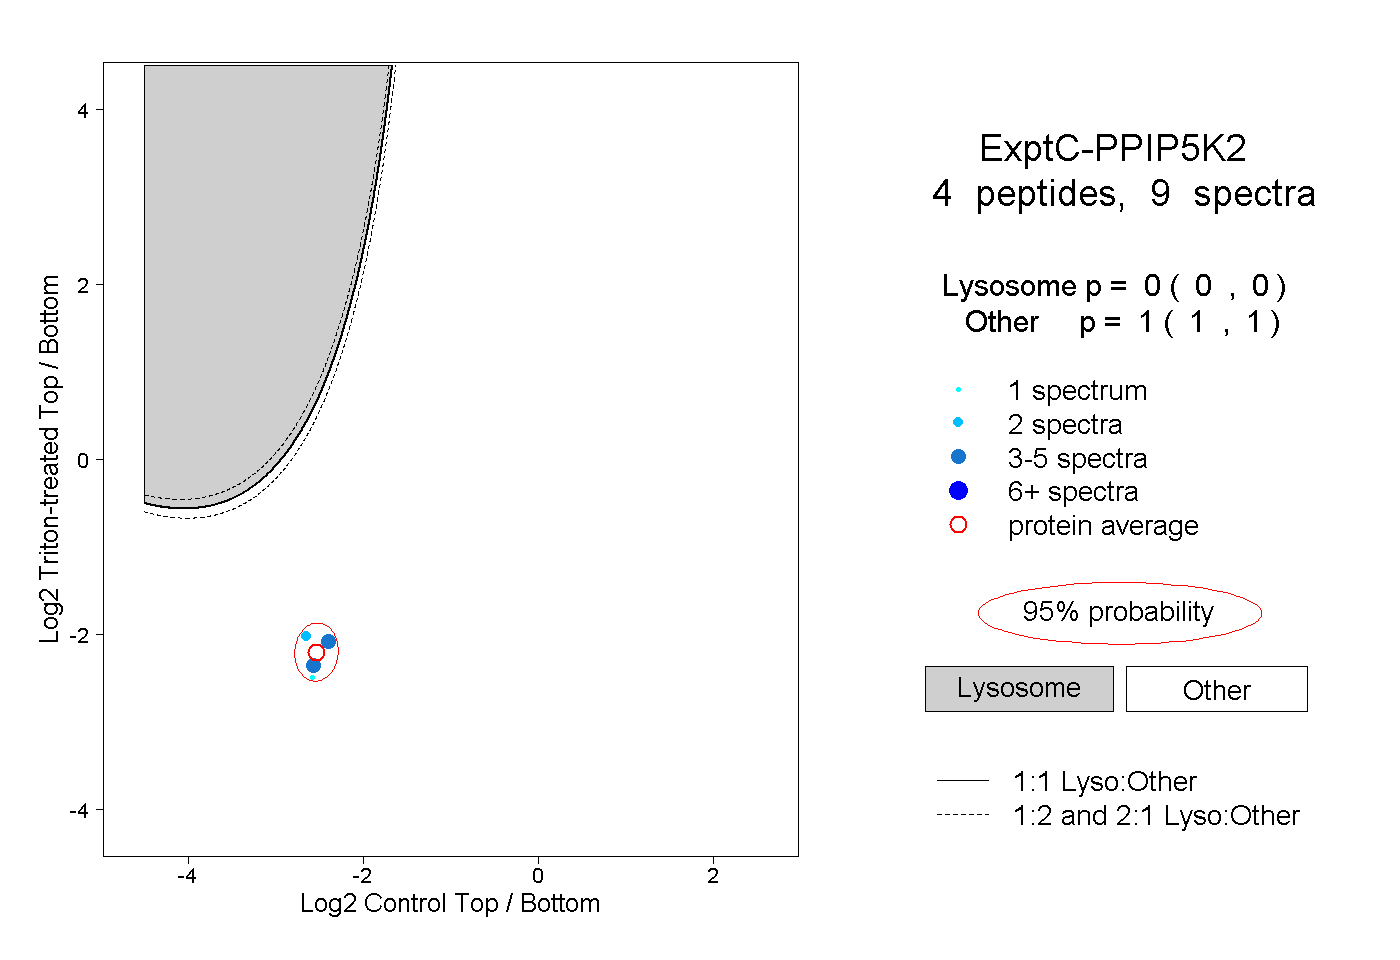 |
0.000 0.000 | 0.000 |
1.000 1.000 | 1.000 |
||||||||
| Plot | Lyso | Other | |||||||||||
| Expt D |
2 peptides |
2 spectra |
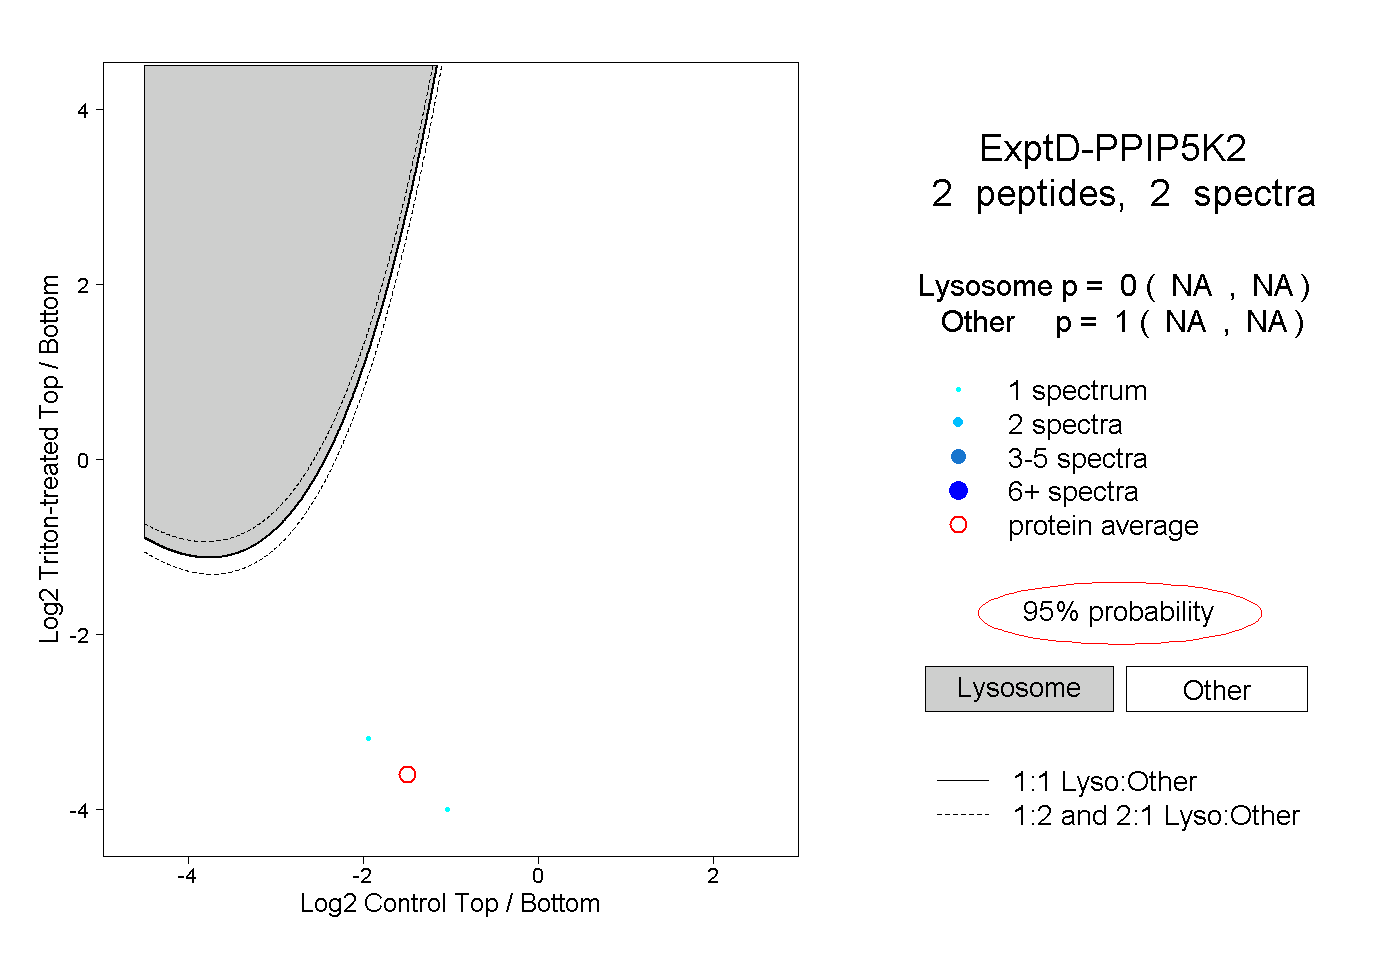 |
0.000 NA | NA |
1.000 NA | NA |