 2
2peptides
spectra
0.000 | 0.000
0.000 | 0.000
0.000 | 0.000
0.000 | 0.110
0.000 | 0.130
0.000 | 0.000
0.591 | 0.700
0.188 | 0.345
1peptide
spectrum
NA | NA
NA | NA
NA | NA
NA | NA
NA | NA
NA | NA
NA | NA
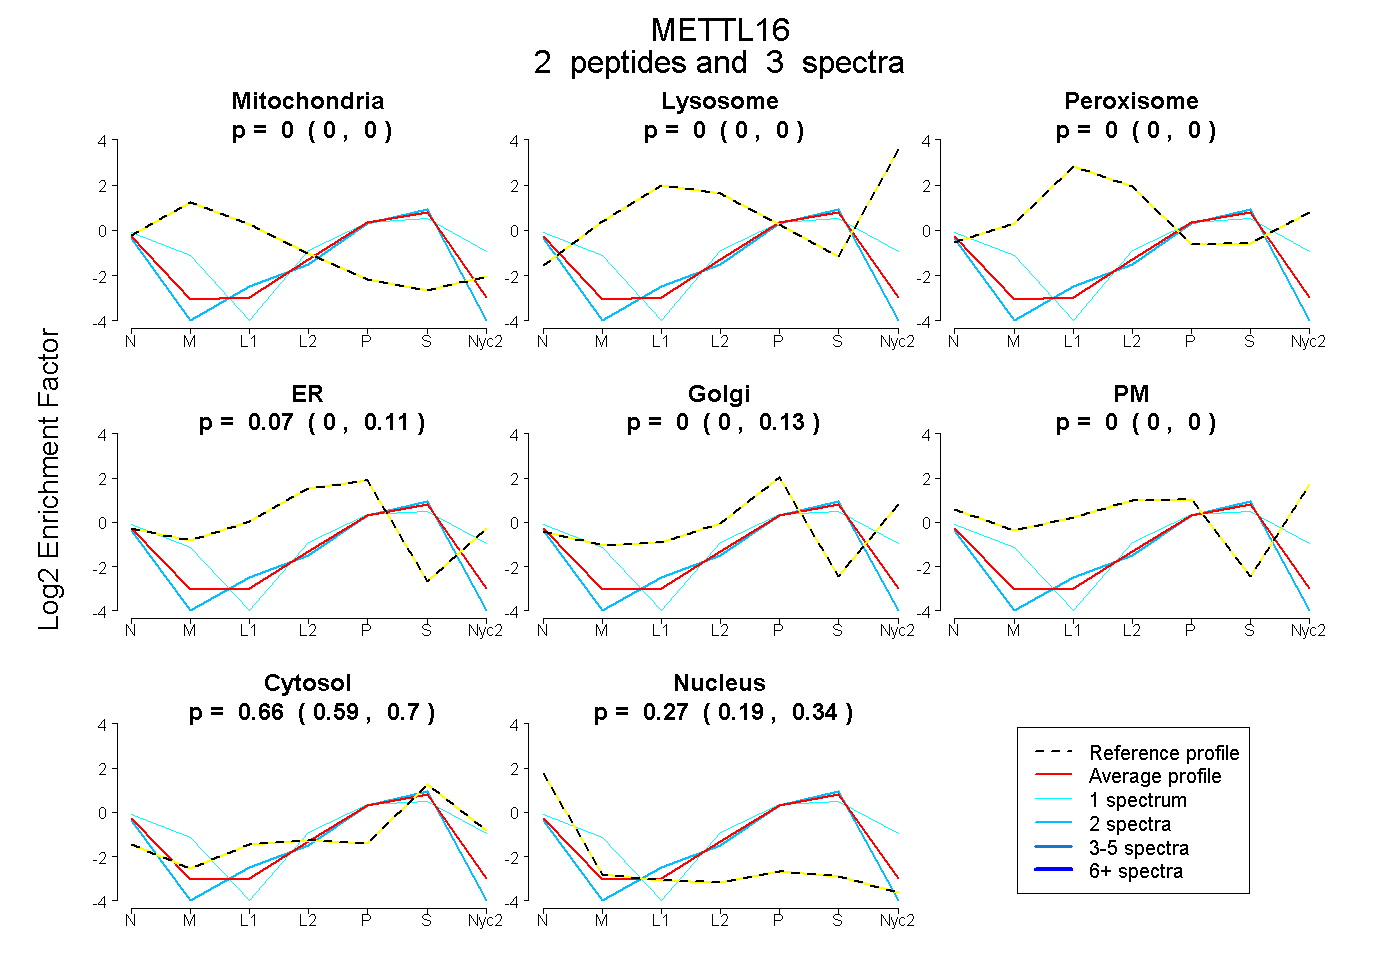
| Plot | Mito | Lyso | Perox | ER | Golgi | PM | Cytosol | Nucleus | |||||
| Expt A |
2 peptides |
3 spectra |
|
0.000 0.000 | 0.000 |
0.000 0.000 | 0.000 |
0.000 0.000 | 0.000 |
0.067 0.000 | 0.110 |
0.000 0.000 | 0.130 |
0.000 0.000 | 0.000 |
0.658 0.591 | 0.700 |
0.275 0.188 | 0.345 |
||
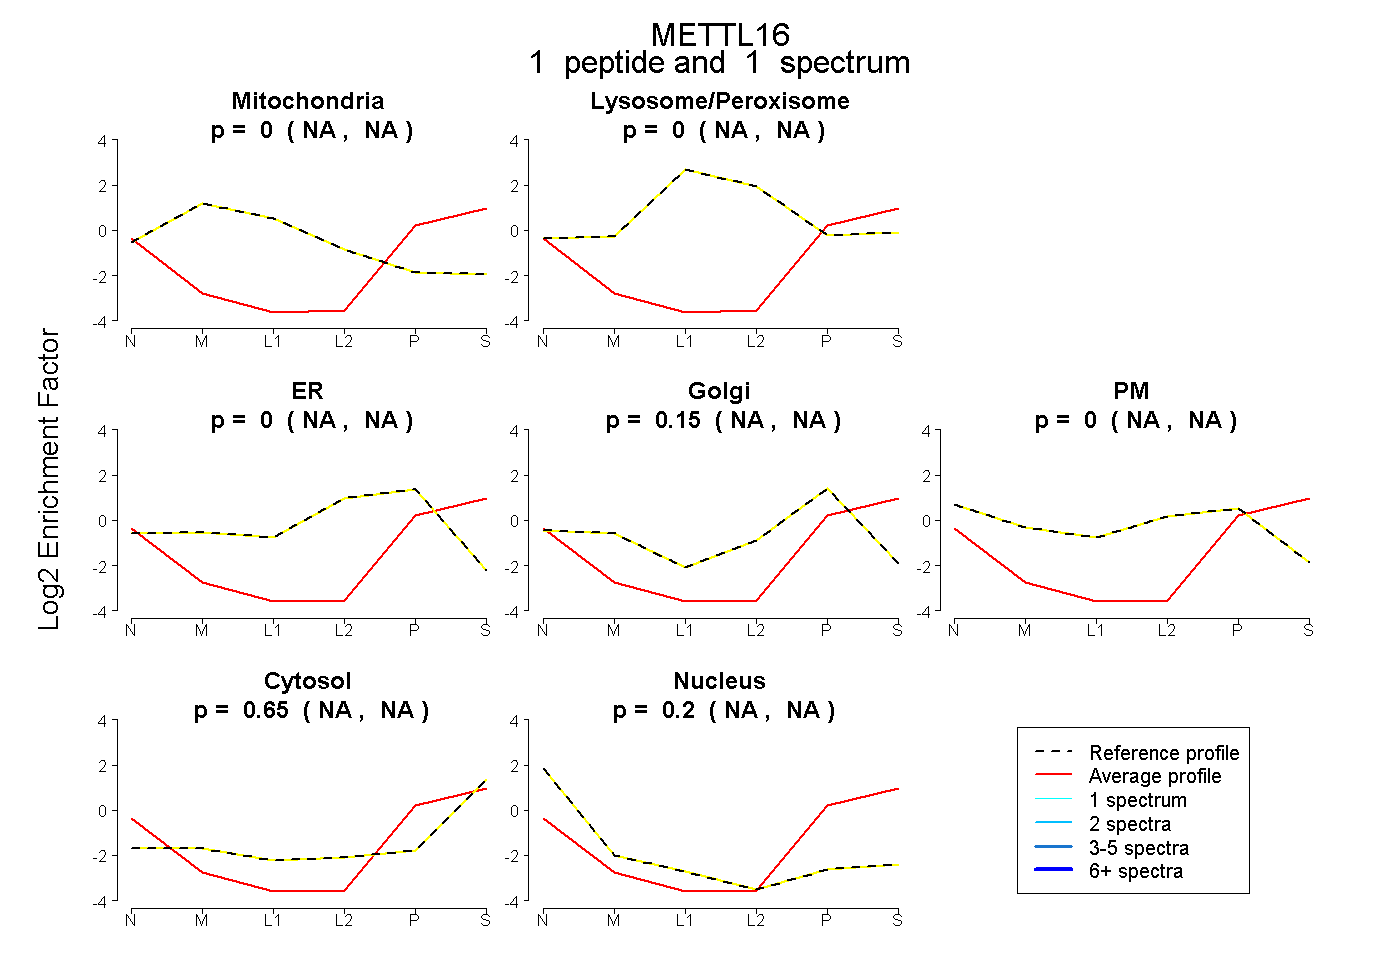
| Plot | Mito | Lyso or Perox | ER | Golgi | PM | Cytosol | Nucleus | ||||||
| Expt B |
1 peptide |
1 spectrum |
|
0.000 NA | NA |
0.000 NA | NA |
0.000 NA | NA |
0.152 NA | NA |
0.000 NA | NA |
0.650 NA | NA |
0.198 NA | NA |