 4
4peptides
spectra
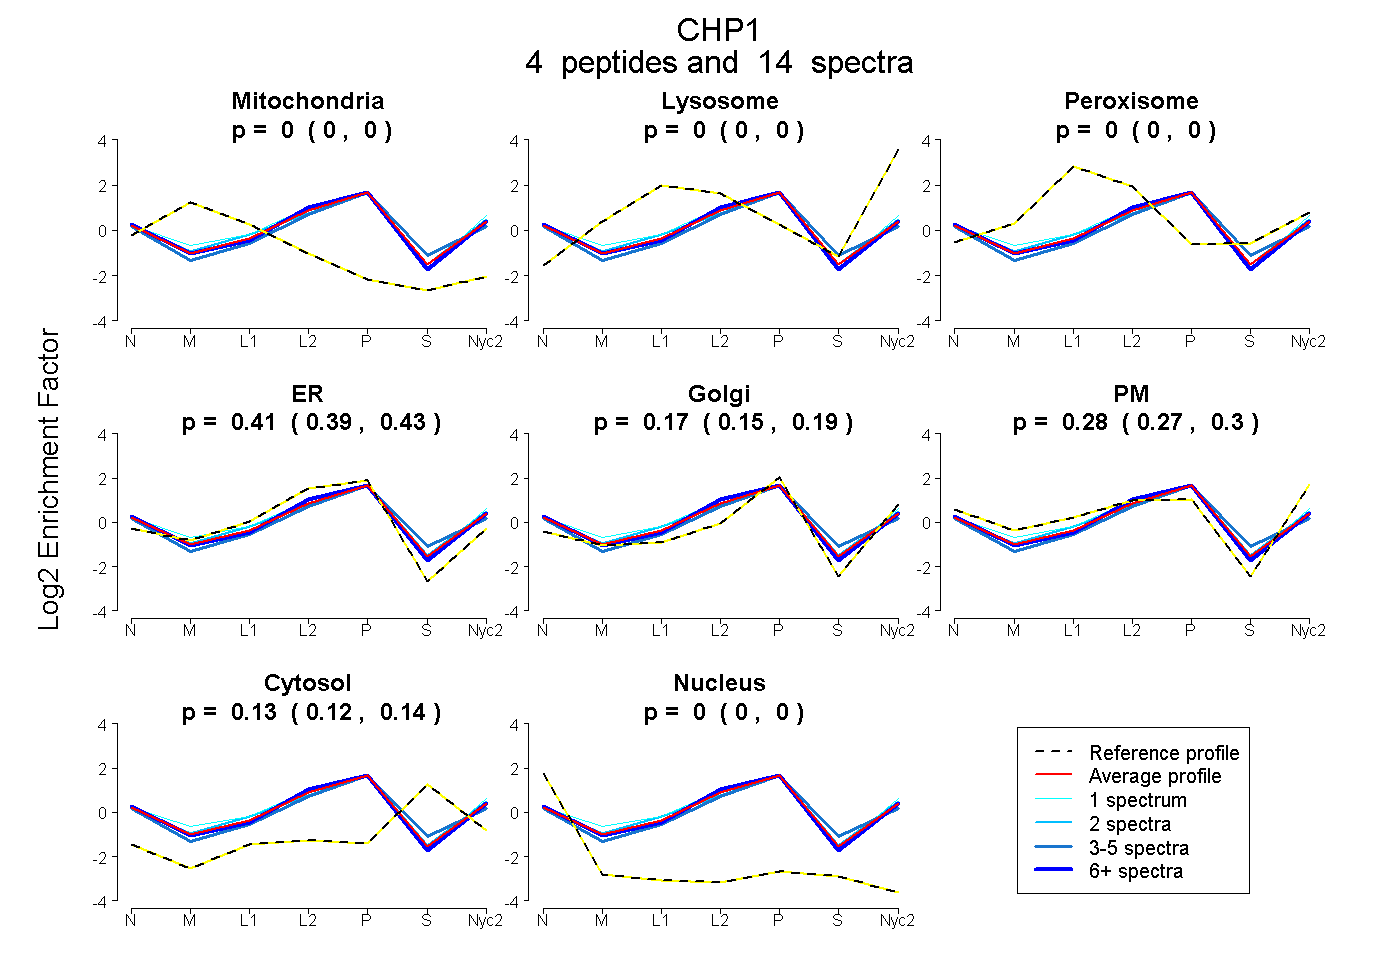
0.000 | 0.000
0.000 | 0.000
0.000 | 0.000
0.389 | 0.431
0.146 | 0.194
0.266 | 0.299
0.124 | 0.142
0.000 | 0.000
2peptides
spectra
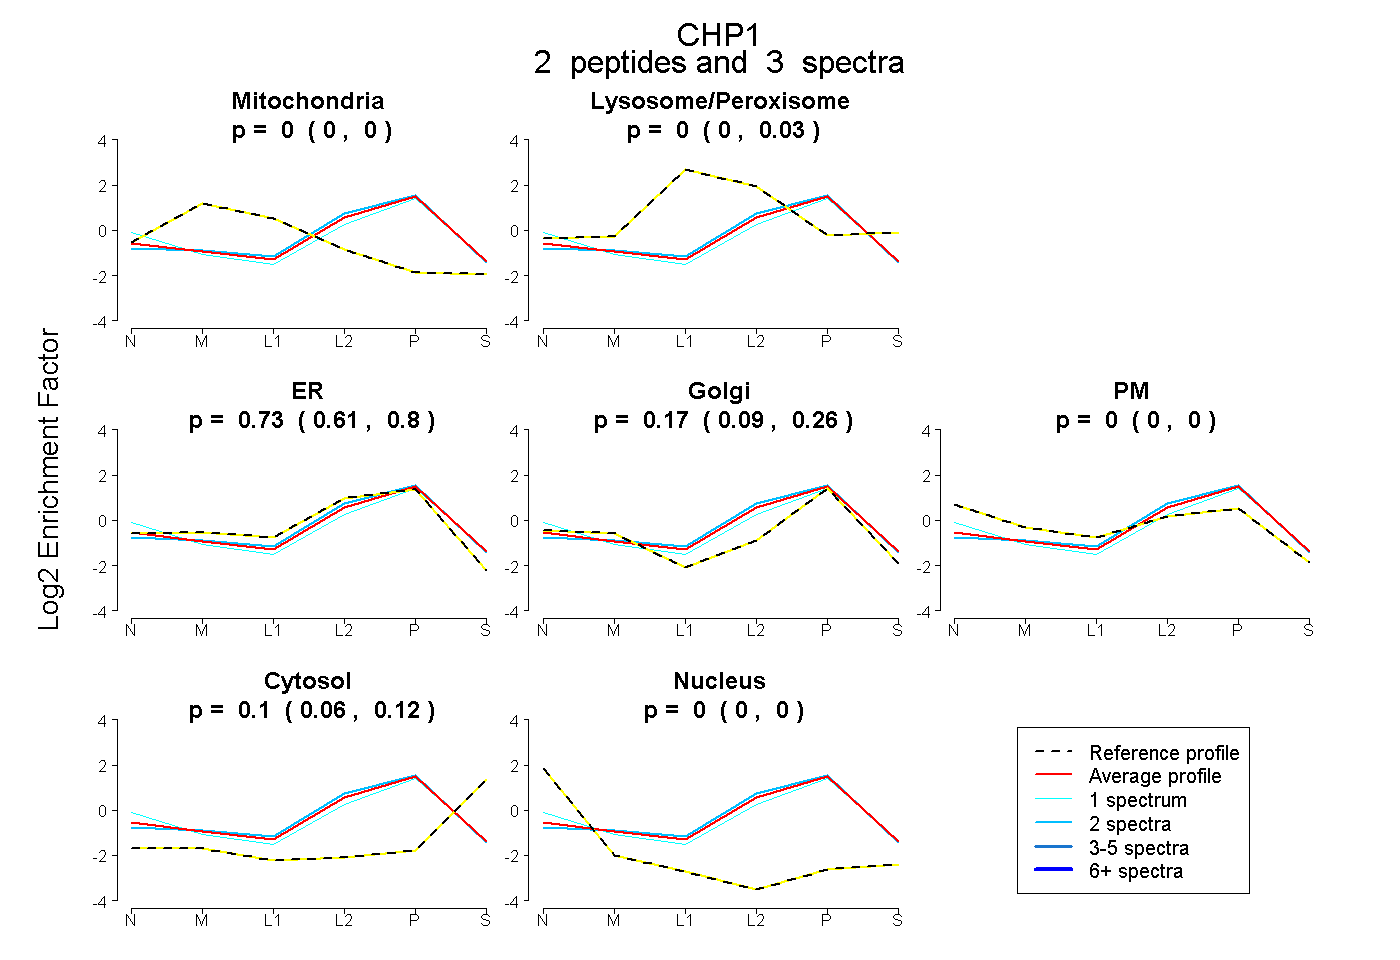
0.000 | 0.000
0.000 | 0.031
0.605 | 0.797
0.088 | 0.264
0.000 | 0.000
0.062 | 0.115
0.000 | 0.000
6peptides
spectra
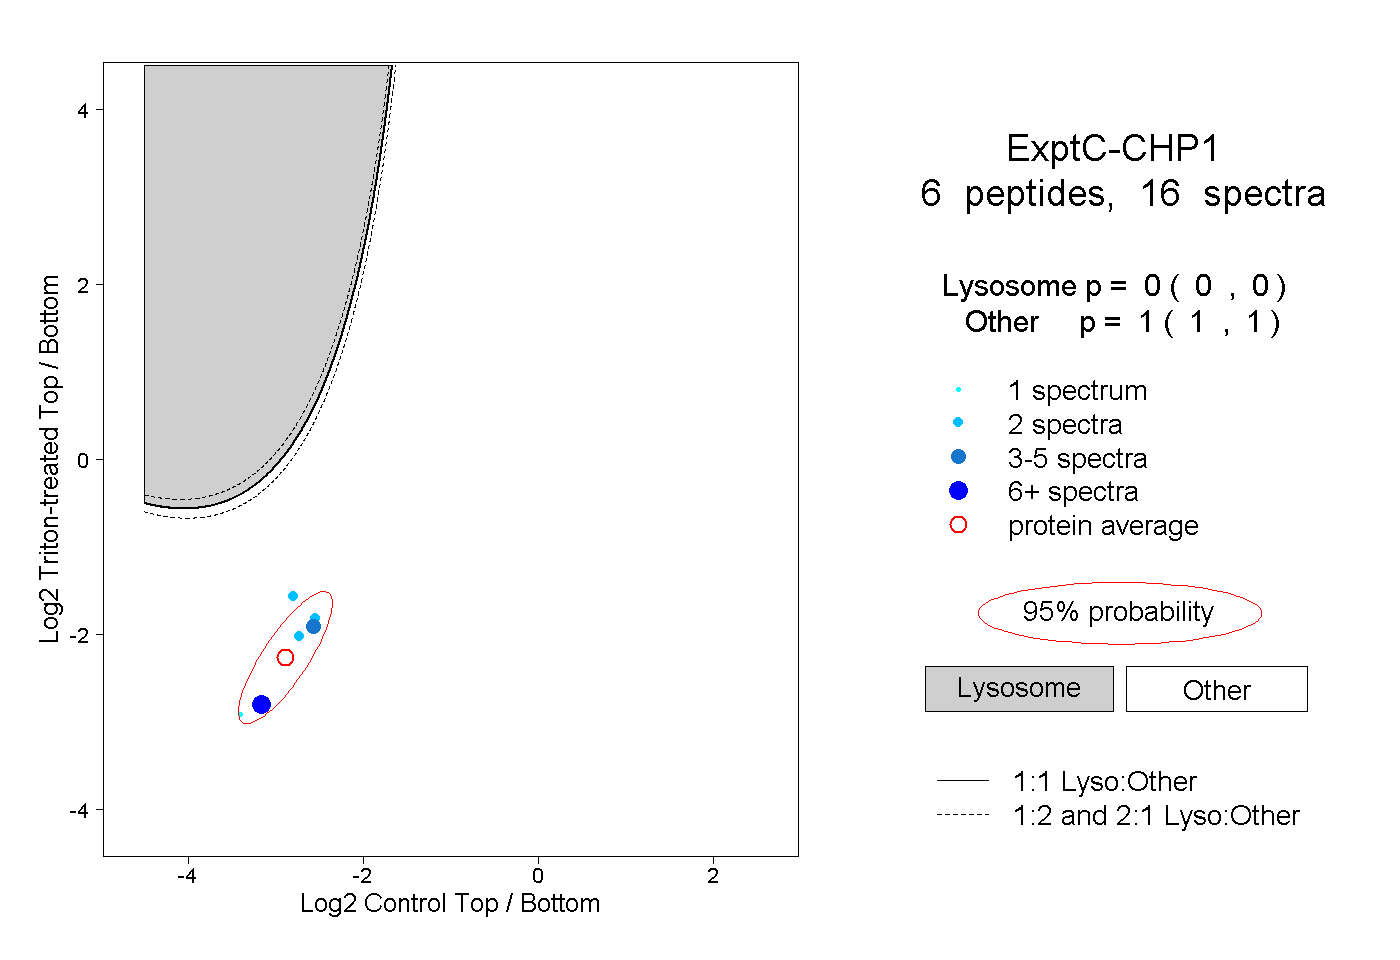
0.000 | 0.000
1.000 | 1.000