 5
5peptides
spectra
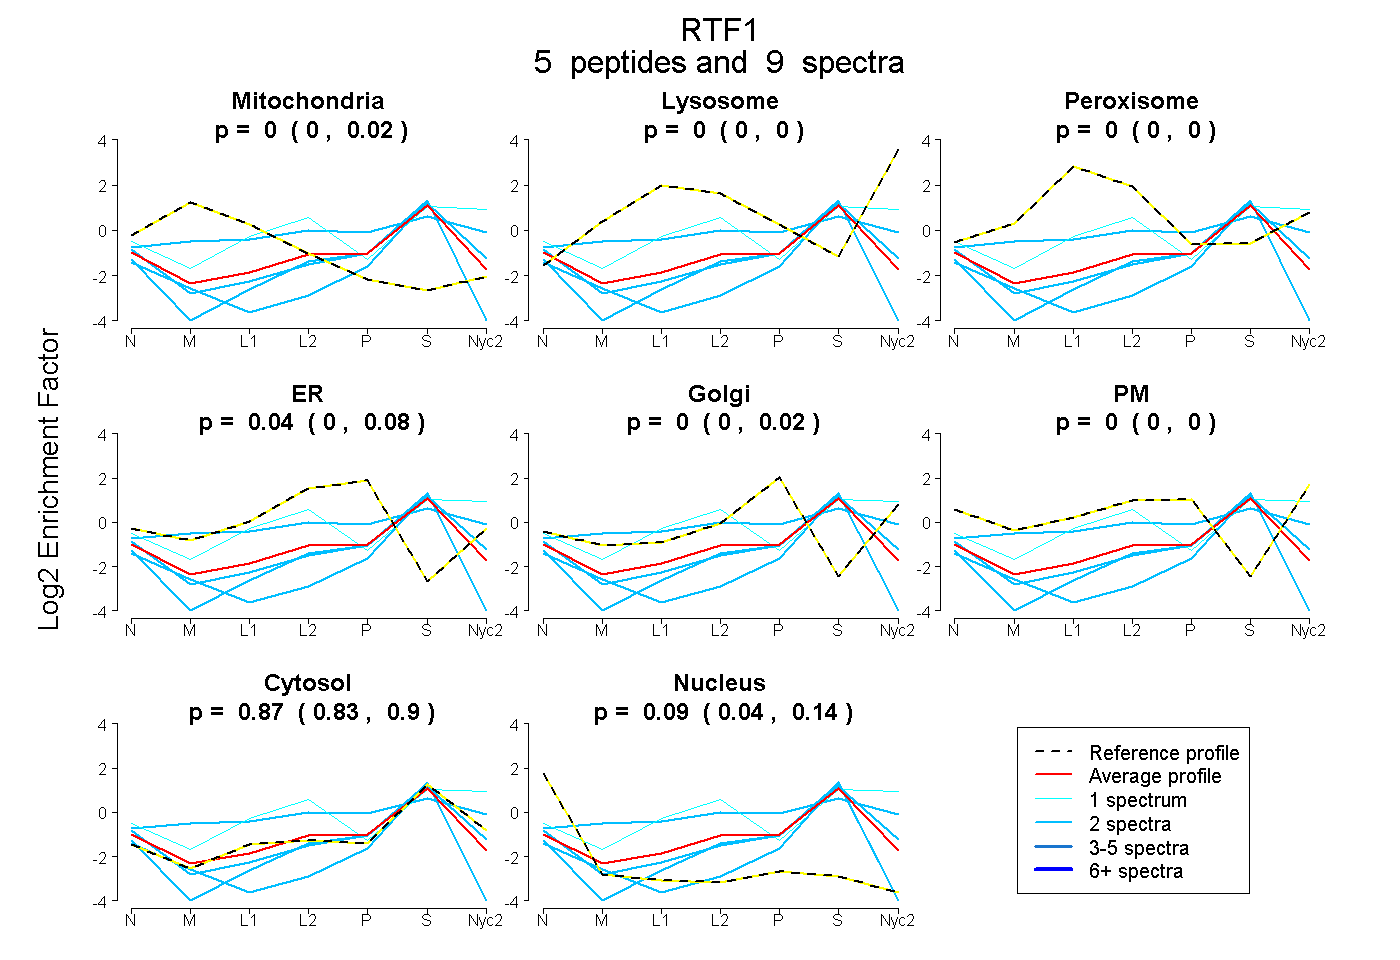
0.000 | 0.023
0.000 | 0.000
0.000 | 0.000
0.000 | 0.077
0.000 | 0.020
0.000 | 0.000
0.828 | 0.896
0.036 | 0.136
1peptide
spectrum
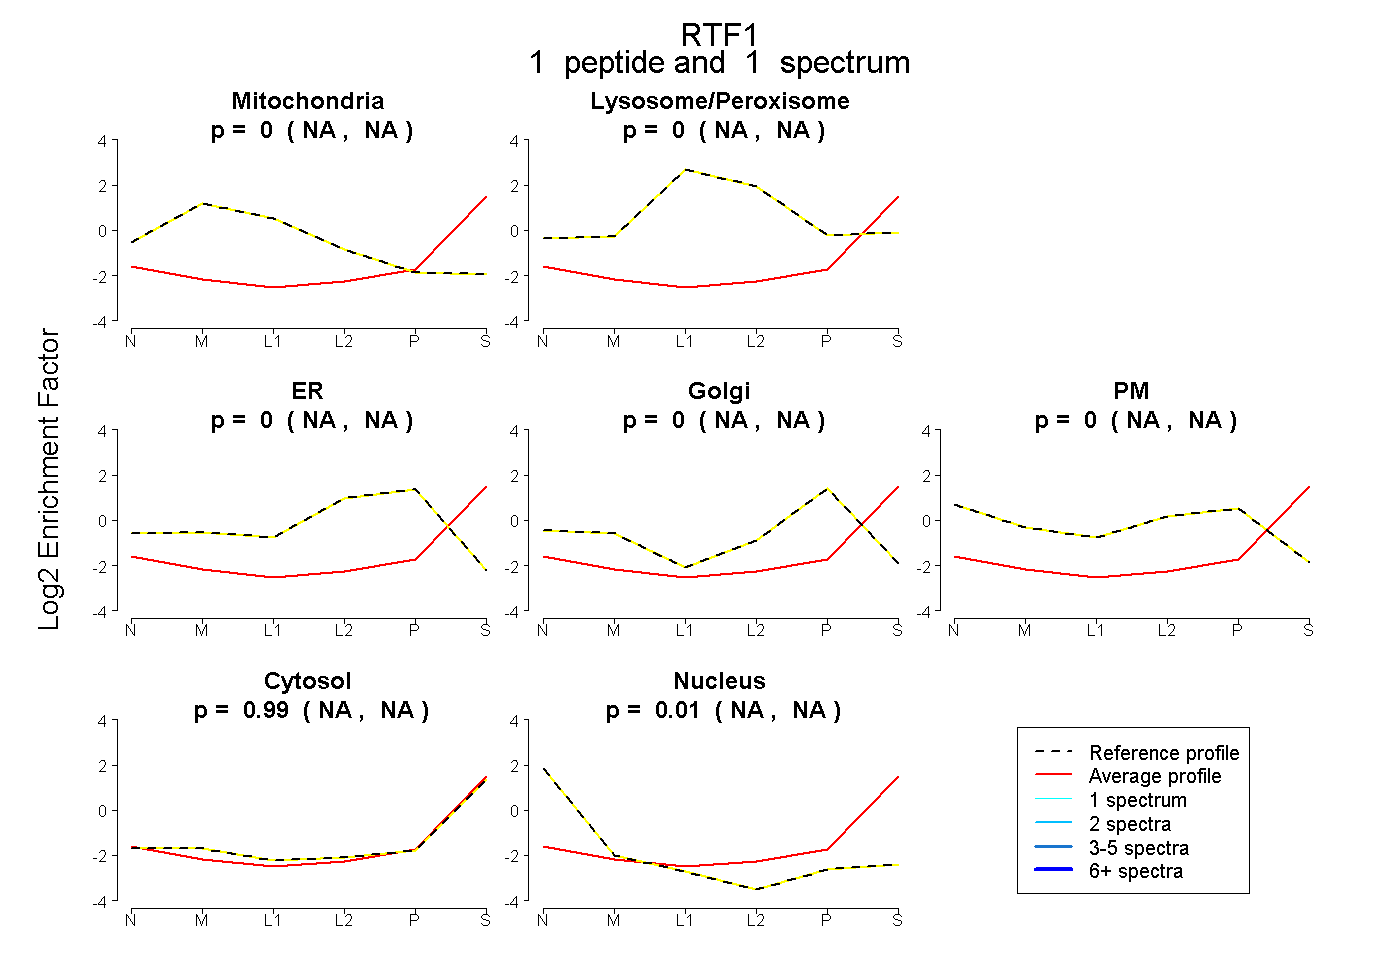
NA | NA
NA | NA
NA | NA
NA | NA
NA | NA
NA | NA
NA | NA
1peptide
spectrum
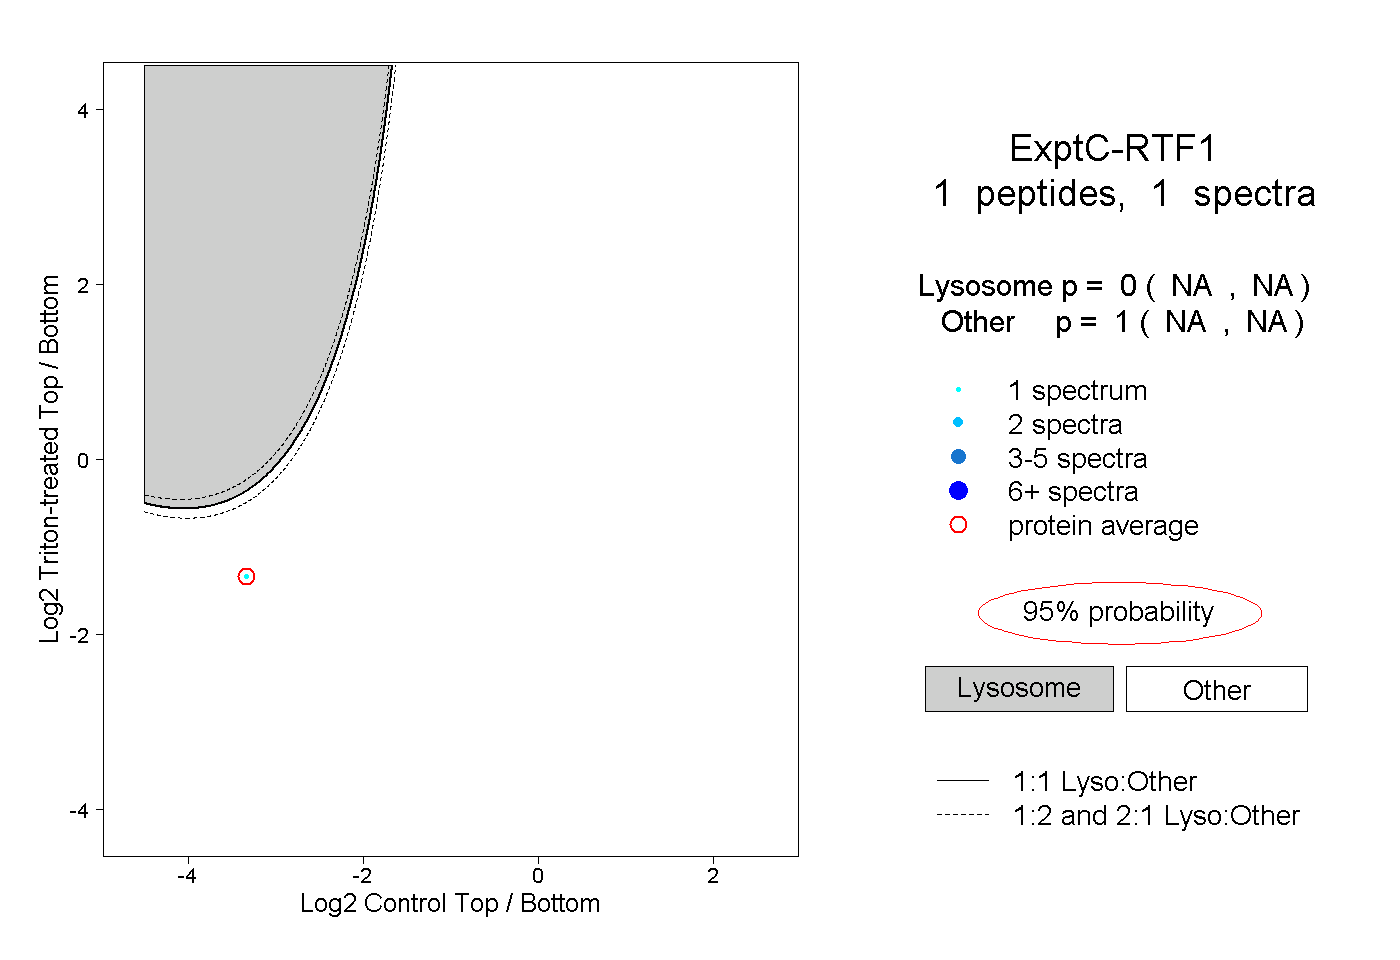
NA | NA
NA | NA