 3
3peptides
spectra
0.000 | 0.000
0.000 | 0.152
0.000 | 0.092
0.000 | 0.271
0.000 | 0.143
0.430 | 0.681
0.071 | 0.167
0.000 | 0.000
8peptides
spectra
0.000 | 0.000
1.000 | 1.000
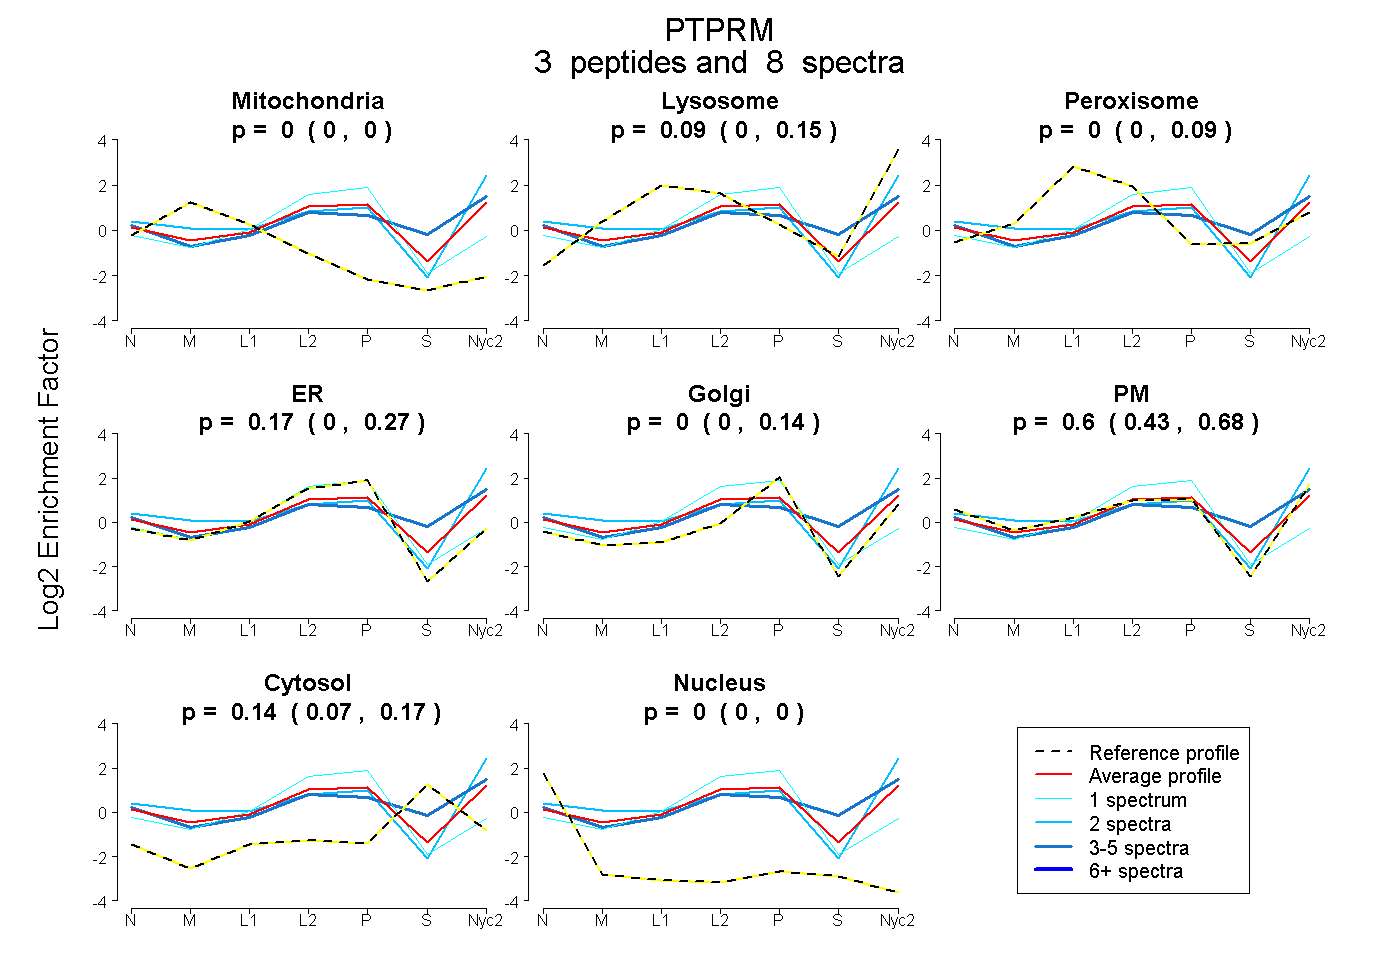
| Plot | Mito | Lyso | Perox | ER | Golgi | PM | Cytosol | Nucleus | |||||
| Expt A |
3 peptides |
8 spectra |
|
0.000 0.000 | 0.000 |
0.095 0.000 | 0.152 |
0.000 0.000 | 0.092 |
0.174 0.000 | 0.271 |
0.000 0.000 | 0.143 |
0.596 0.430 | 0.681 |
0.135 0.071 | 0.167 |
0.000 0.000 | 0.000 |
||
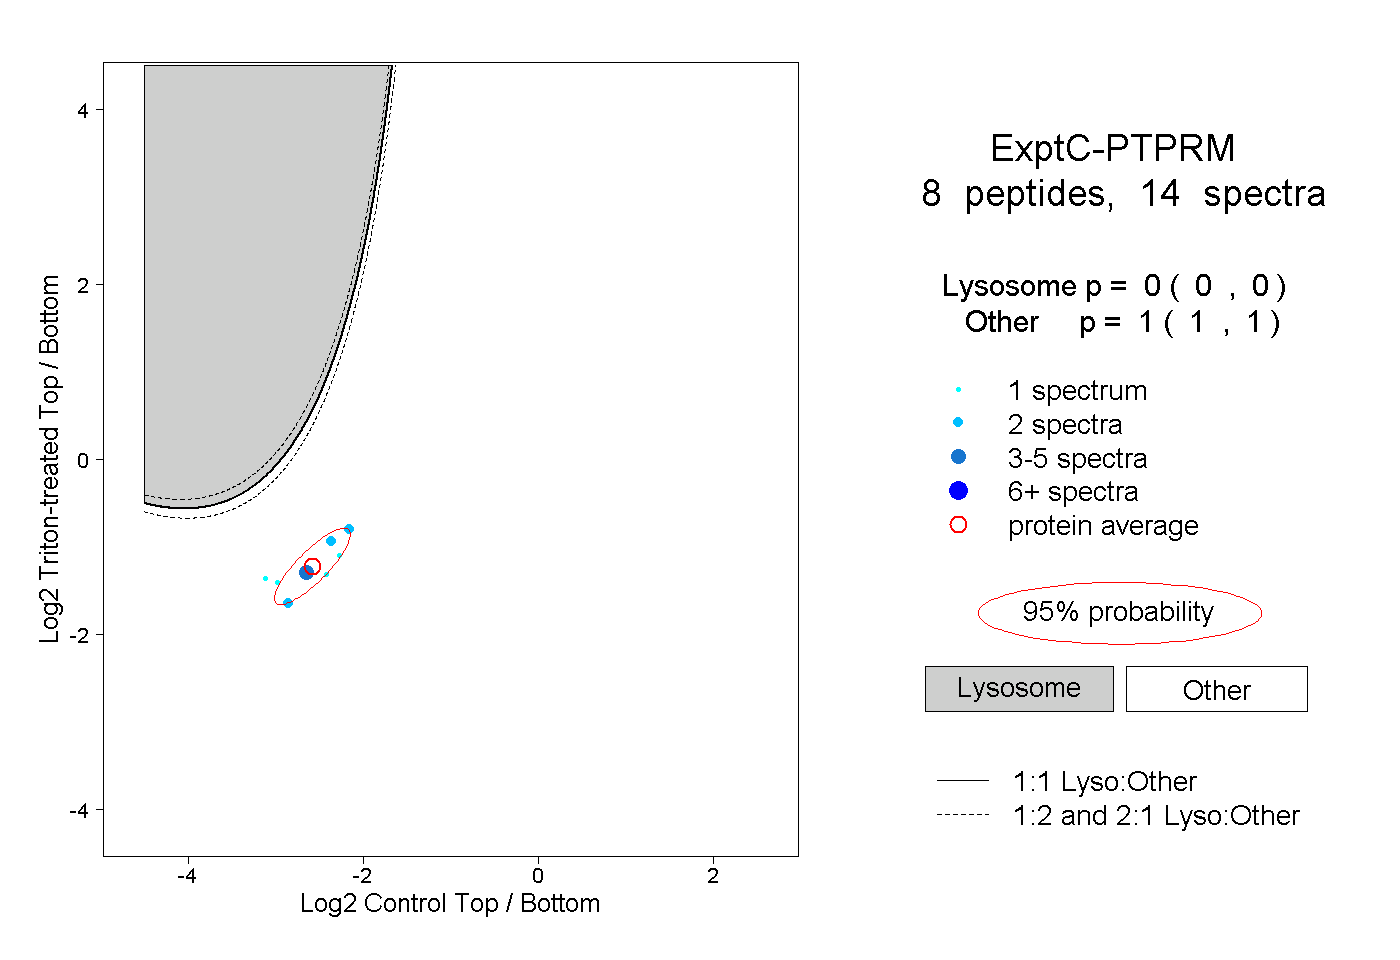
| Plot | Lyso | Other | |||||||||||
| Expt C |
8 peptides |
14 spectra |
|
0.000 0.000 | 0.000 |
1.000 1.000 | 1.000 |