 5
5peptides
spectra
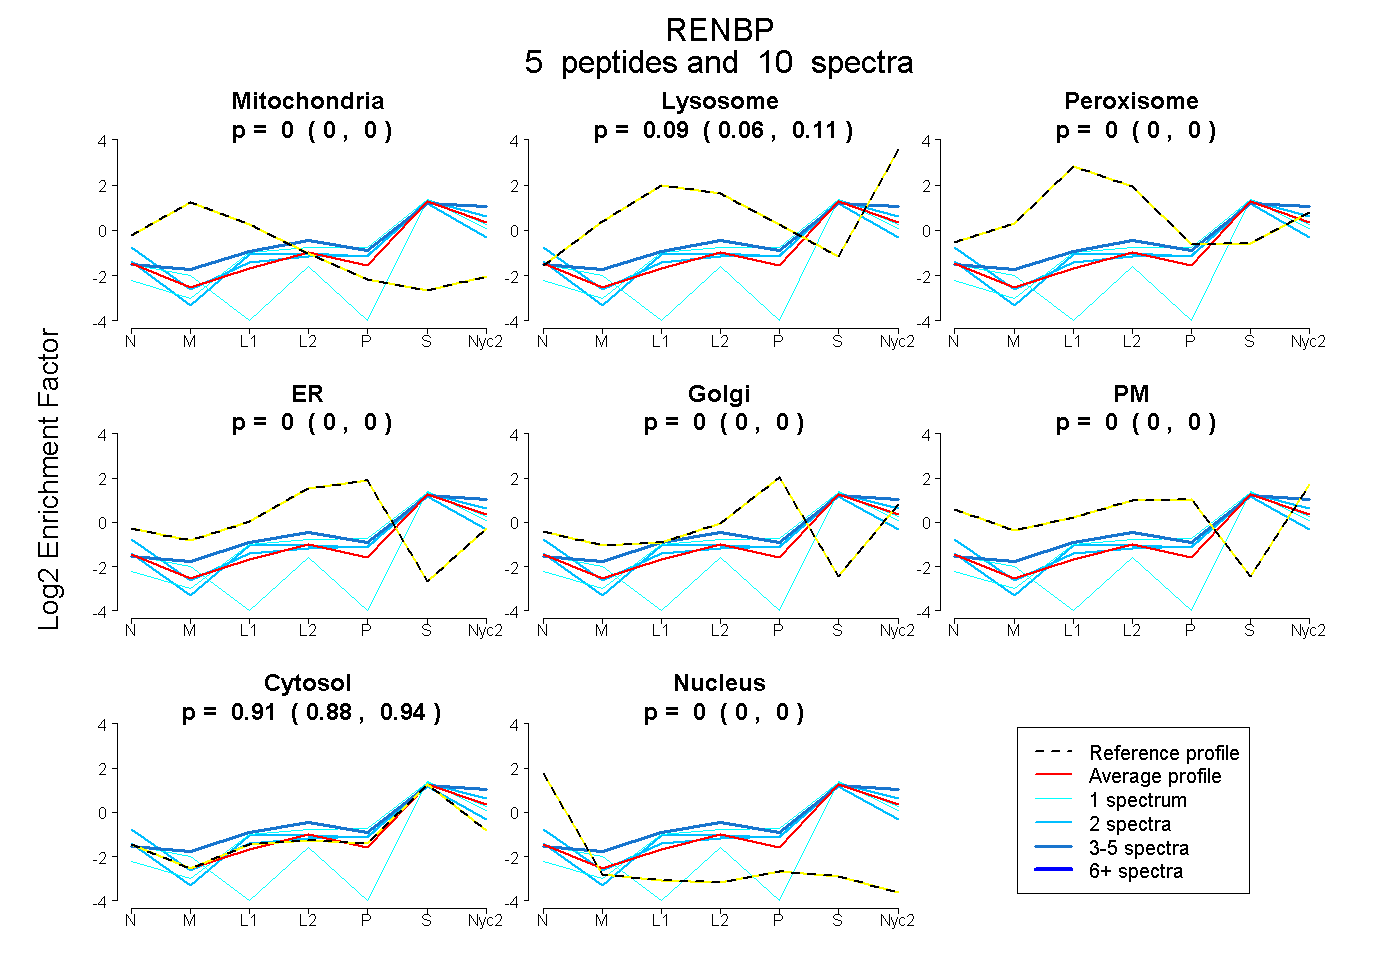
0.000 | 0.000
0.058 | 0.112
0.000 | 0.000
0.000 | 0.000
0.000 | 0.000
0.000 | 0.000
0.882 | 0.937
0.000 | 0.000
1peptide
spectrum
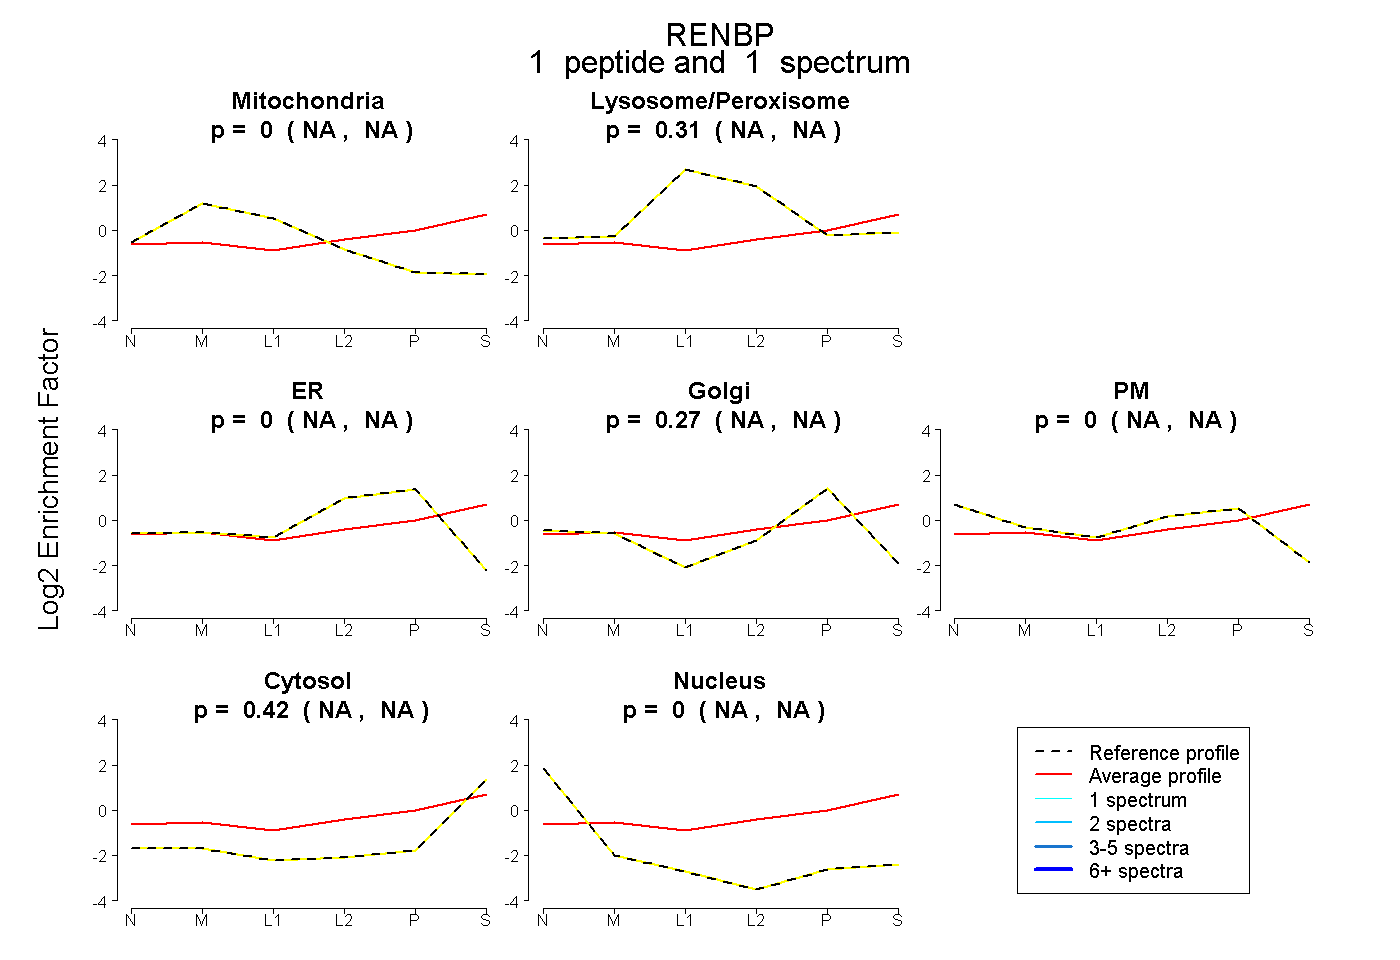
NA | NA
NA | NA
NA | NA
NA | NA
NA | NA
NA | NA
NA | NA
3peptides
spectra
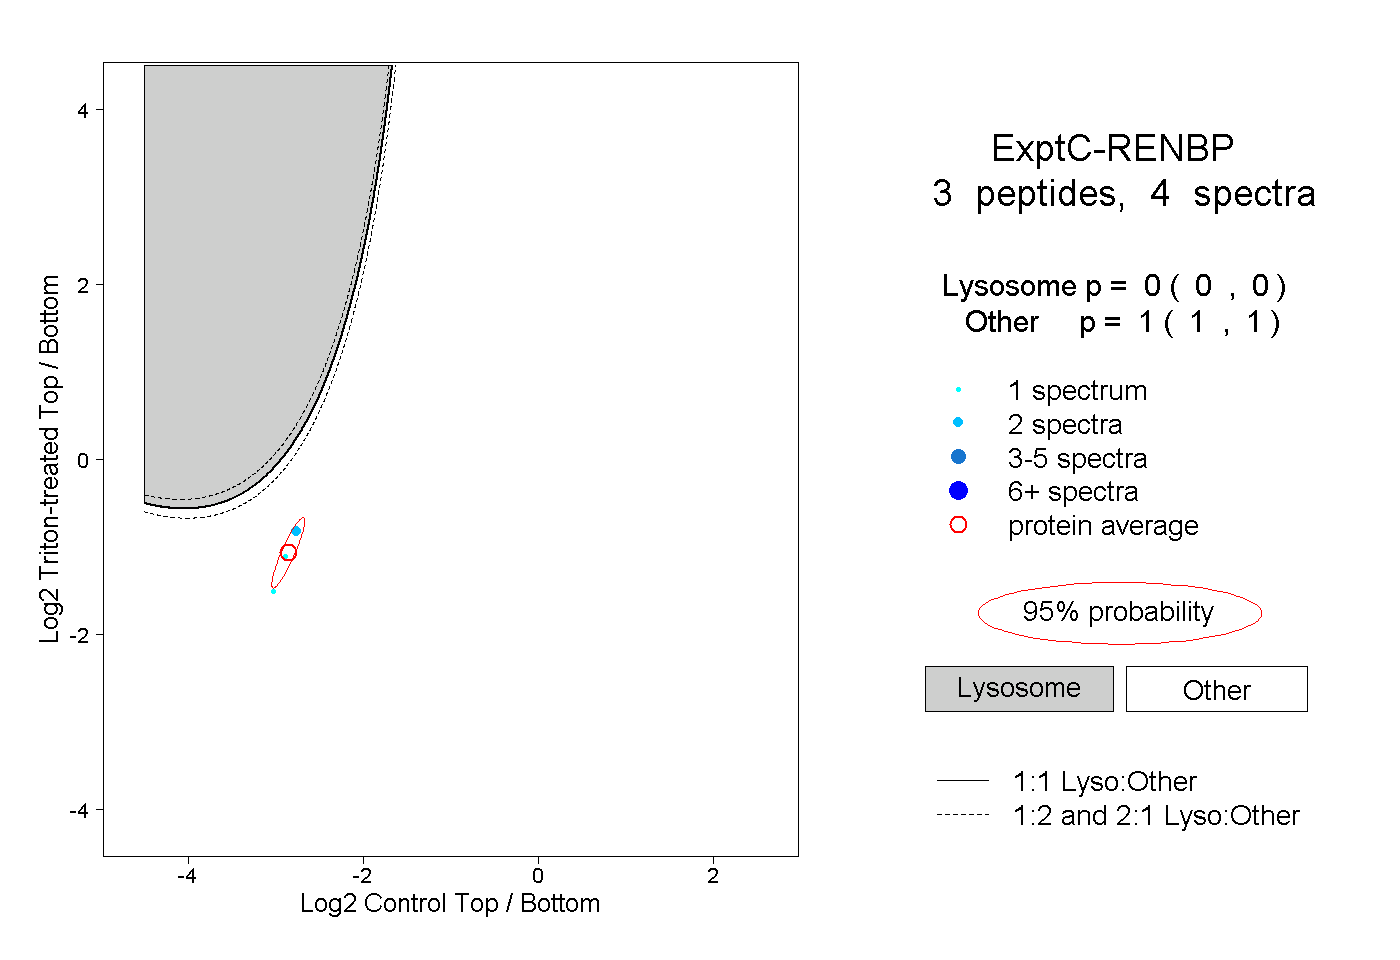
0.000 | 0.000
1.000 | 1.000
1peptide
spectrum
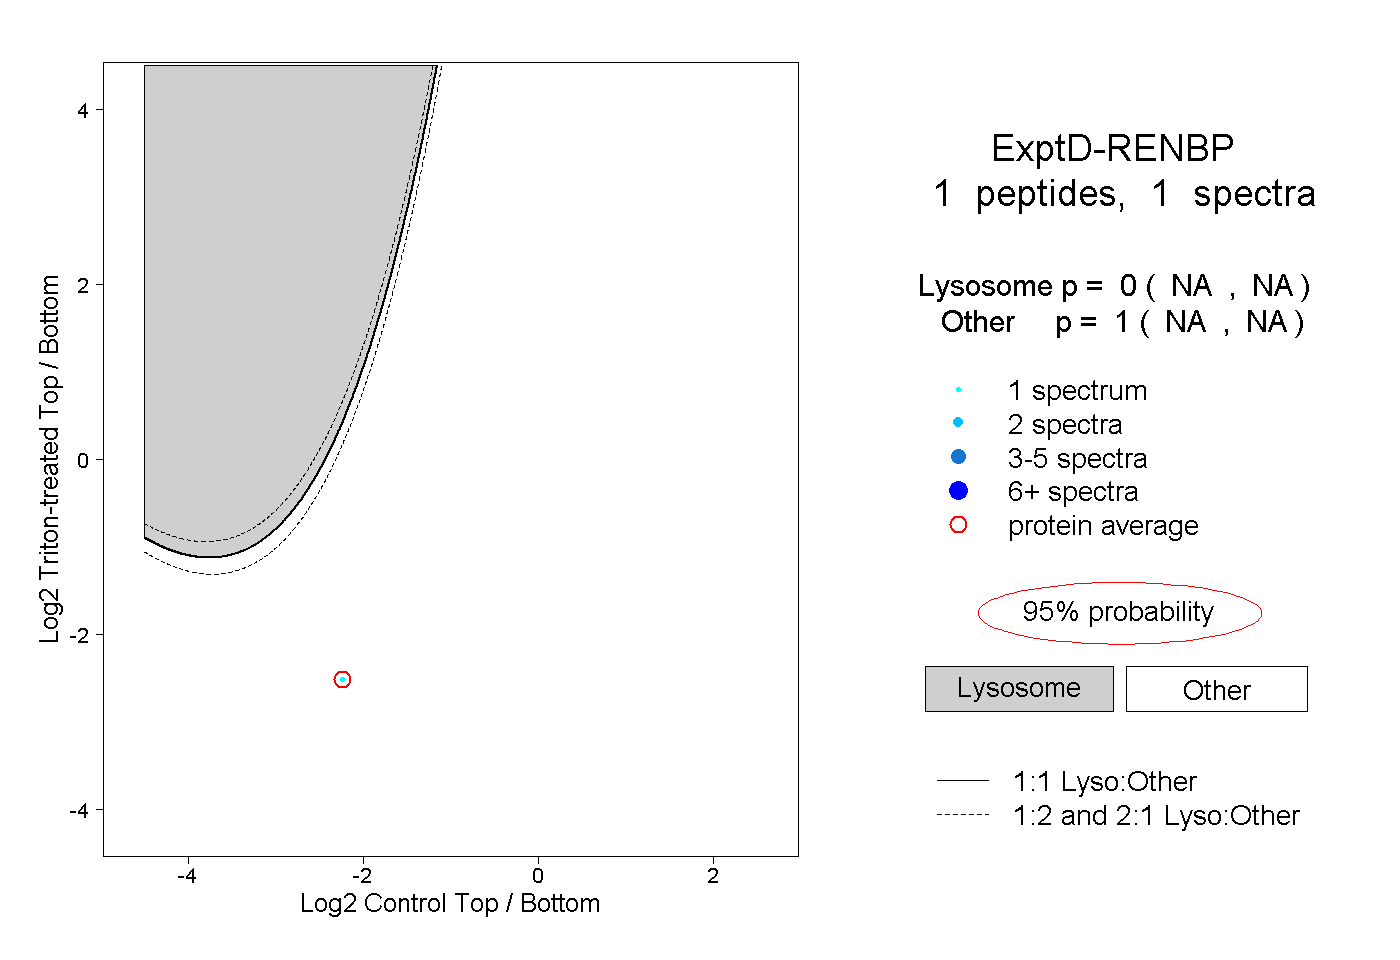
NA | NA
NA | NA