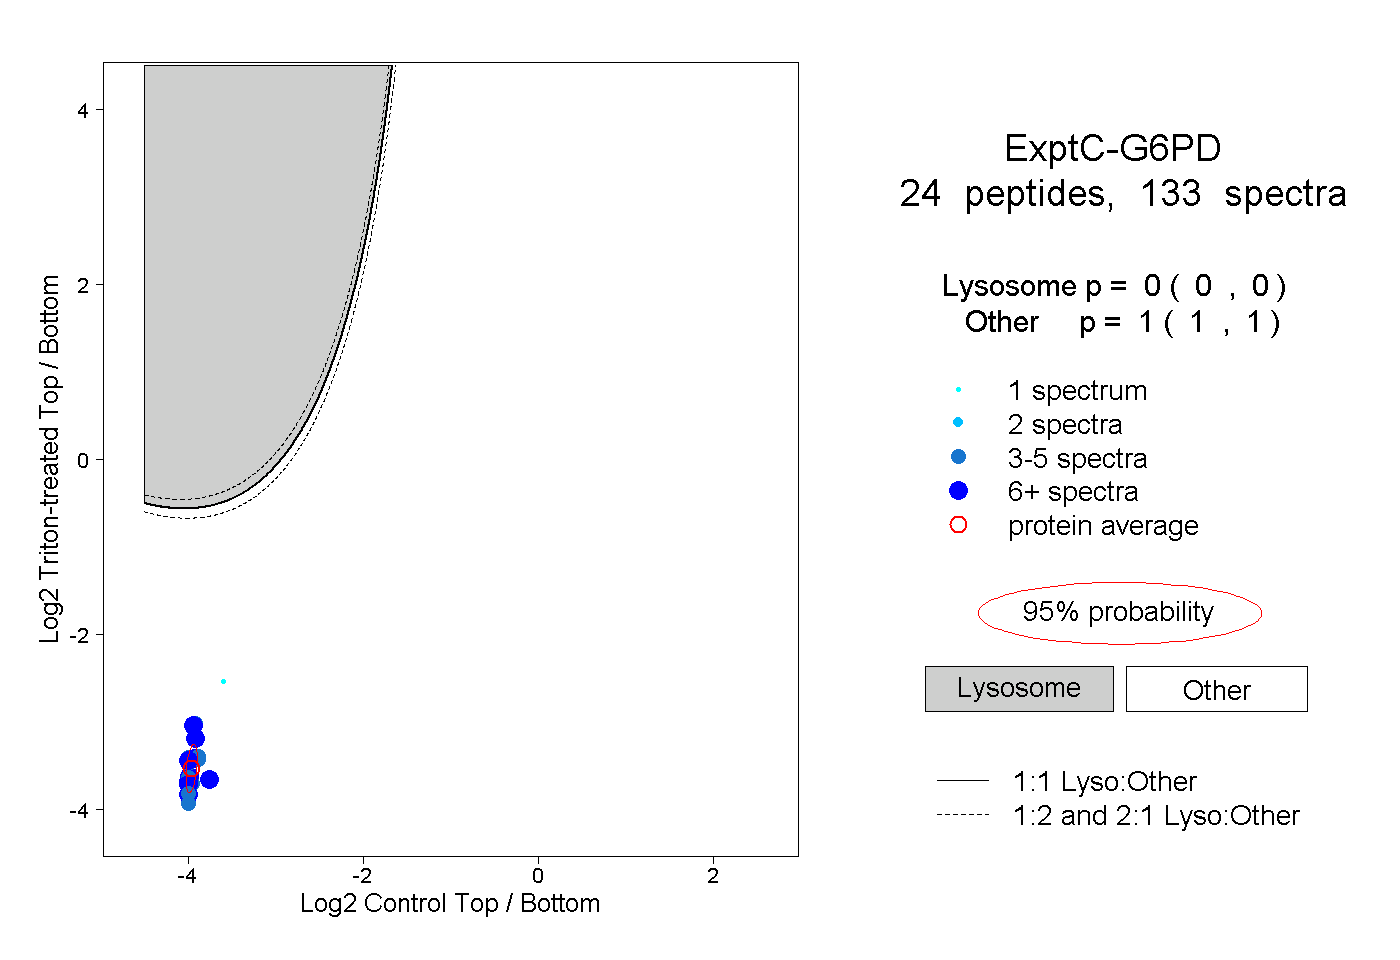
22
22peptides
spectra
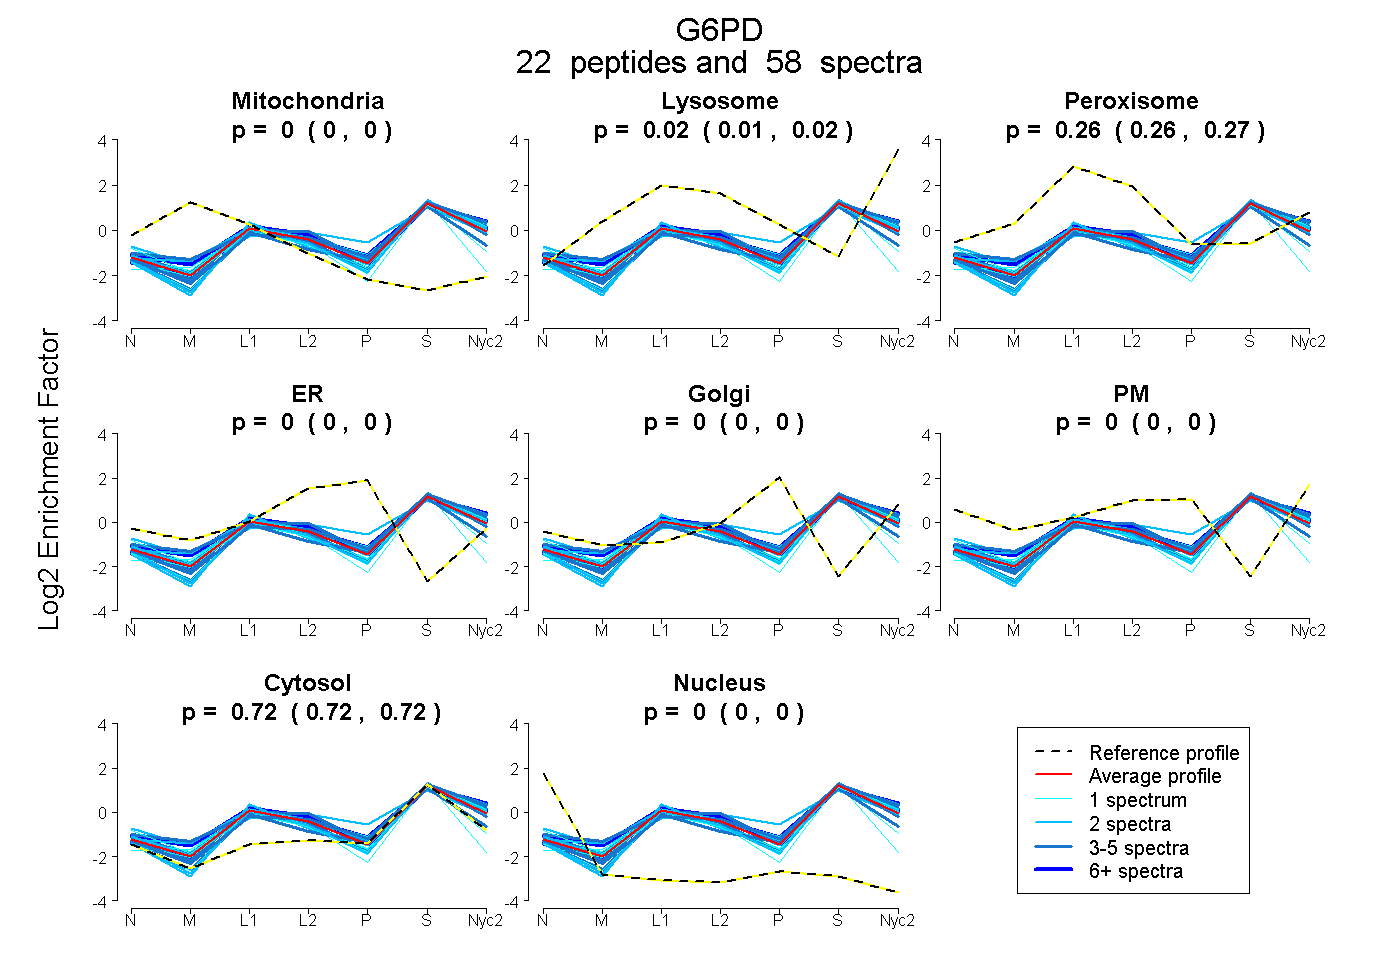
0.000 | 0.000
0.009 | 0.022
0.257 | 0.269
0.000 | 0.000
0.000 | 0.000
0.000 | 0.000
0.718 | 0.722
0.000 | 0.000
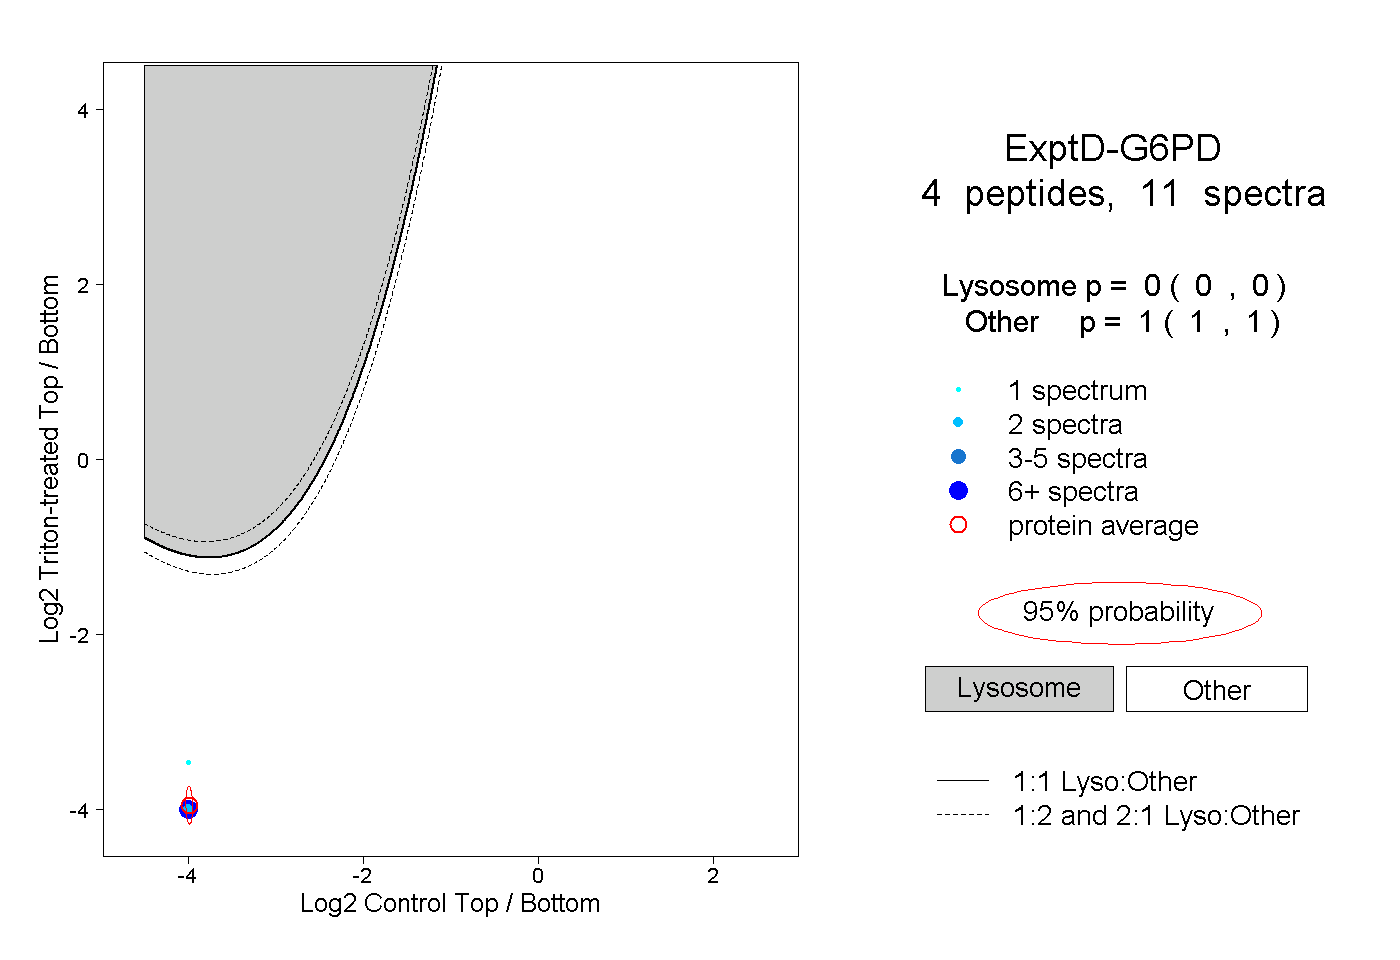
7peptides
spectra
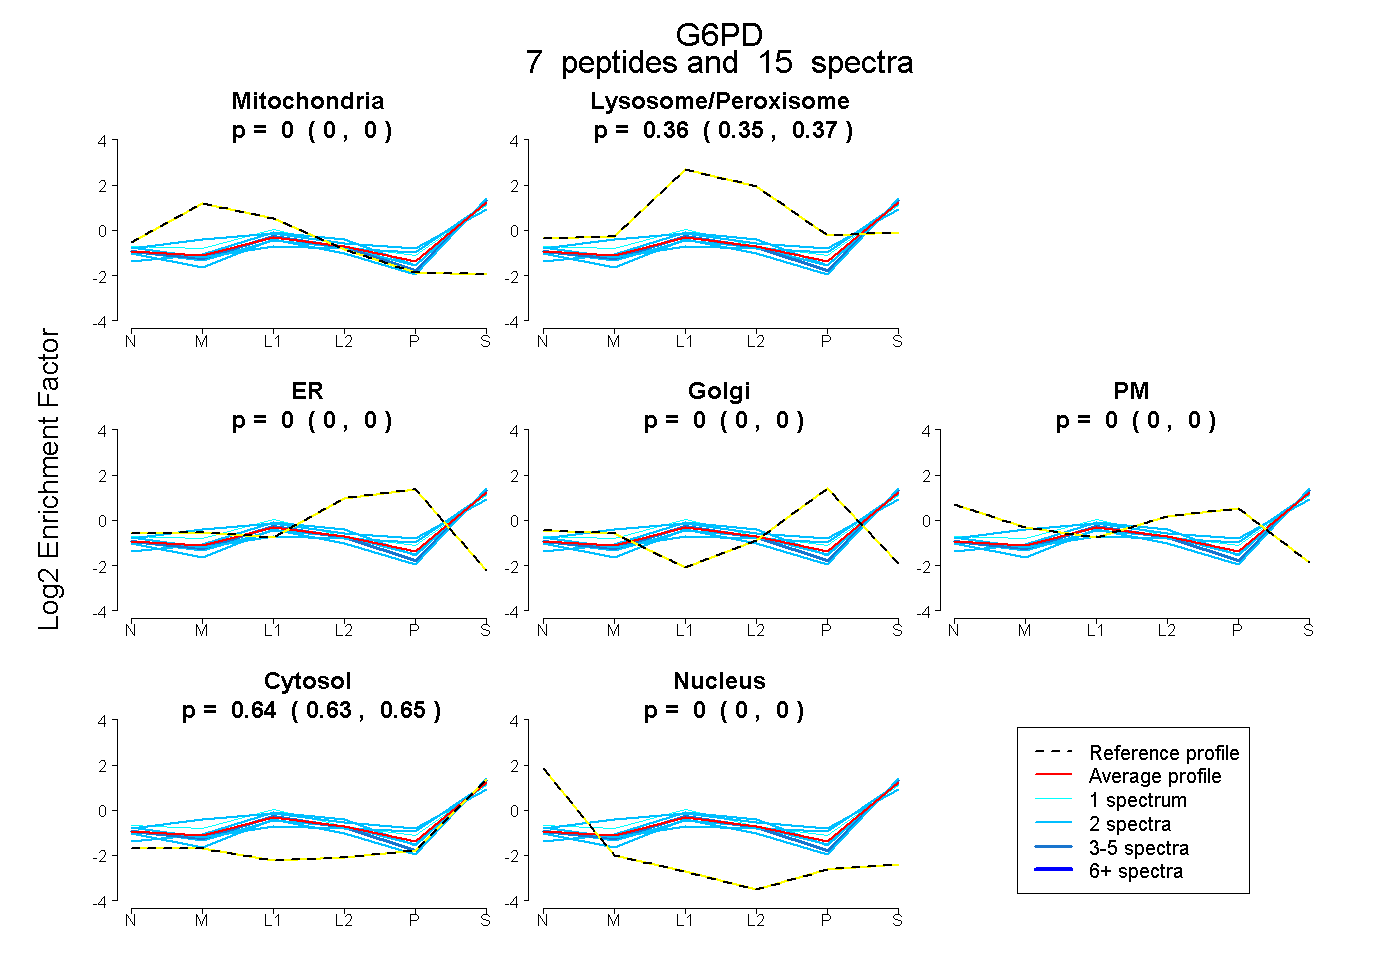
0.000 | 0.000
0.354 | 0.366
0.000 | 0.000
0.000 | 0.000
0.000 | 0.000
0.633 | 0.645
0.000 | 0.000