 22
22peptides
spectra
0.000 | 0.000
0.009 | 0.022
0.257 | 0.269
0.000 | 0.000
0.000 | 0.000
0.000 | 0.000
0.718 | 0.722
0.000 | 0.000
| Plot | Mito | Lyso | Perox | ER | Golgi | PM | Cytosol | Nucleus | |||||
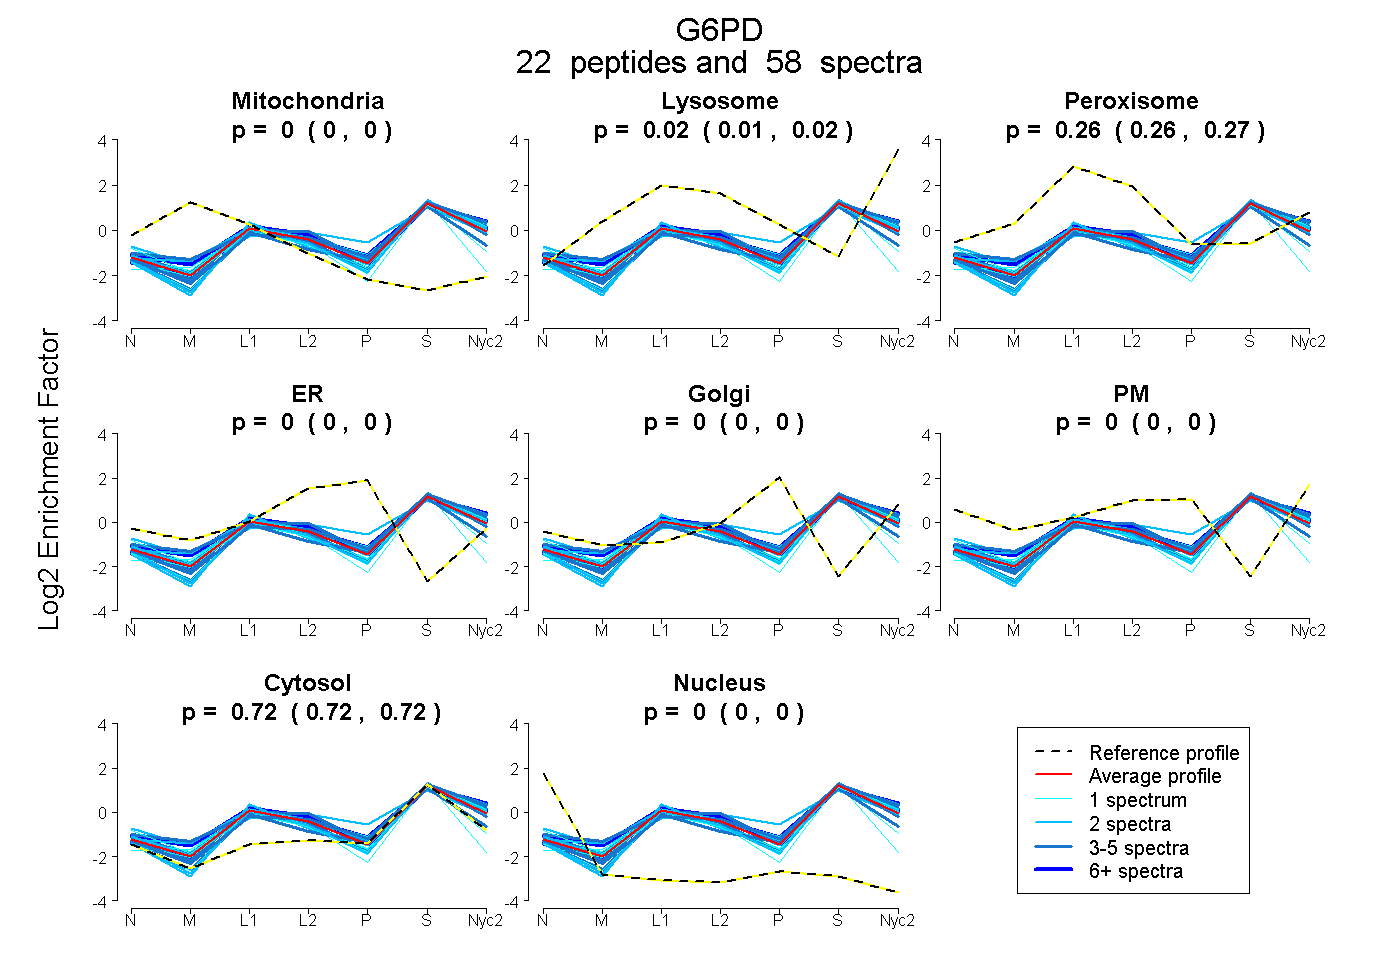
| Expt A |
22 peptides |
58 spectra |
|
0.000 0.000 | 0.000 |
0.016 0.009 | 0.022 |
0.264 0.257 | 0.269 |
0.000 0.000 | 0.000 |
0.000 0.000 | 0.000 |
0.000 0.000 | 0.000 |
0.720 0.718 | 0.722 |
0.000 0.000 | 0.000 |
| 4 spectra, WDGVPFILR | 0.000 | 0.154 | 0.100 | 0.000 | 0.000 | 0.000 | 0.746 | 0.000 | ||
| 1 spectrum, VGFQYEGTYK | 0.000 | 0.052 | 0.164 | 0.000 | 0.000 | 0.000 | 0.784 | 0.000 | ||
| 4 spectra, GGYFDEFGIIR | 0.000 | 0.000 | 0.266 | 0.000 | 0.000 | 0.000 | 0.734 | 0.000 | ||
| 4 spectra, IIVEKPFGR | 0.000 | 0.000 | 0.204 | 0.000 | 0.000 | 0.000 | 0.796 | 0.000 | ||
| 1 spectrum, LPDAYER | 0.000 | 0.000 | 0.266 | 0.000 | 0.000 | 0.000 | 0.734 | 0.000 | ||
| 7 spectra, IFTPLLHK | 0.000 | 0.106 | 0.251 | 0.000 | 0.000 | 0.000 | 0.643 | 0.000 | ||
| 2 spectra, EDQIYR | 0.000 | 0.019 | 0.304 | 0.000 | 0.000 | 0.000 | 0.678 | 0.000 | ||
| 3 spectra, TQVCGILR | 0.072 | 0.000 | 0.226 | 0.000 | 0.000 | 0.000 | 0.702 | 0.000 | ||
| 5 spectra, LEEFFAR | 0.000 | 0.103 | 0.218 | 0.000 | 0.000 | 0.000 | 0.678 | 0.000 | ||
| 1 spectrum, IPDFESR | 0.000 | 0.081 | 0.182 | 0.000 | 0.000 | 0.000 | 0.738 | 0.000 | ||
| 3 spectra, EKPQPIPYVYGSR | 0.000 | 0.004 | 0.312 | 0.000 | 0.000 | 0.000 | 0.684 | 0.000 | ||
| 2 spectra, NELVIR | 0.000 | 0.070 | 0.271 | 0.000 | 0.000 | 0.000 | 0.659 | 0.000 | ||
| 6 spectra, EMVQNLMVLR | 0.000 | 0.095 | 0.188 | 0.000 | 0.000 | 0.000 | 0.717 | 0.000 | ||
| 2 spectra, QSEPFFK | 0.000 | 0.098 | 0.208 | 0.000 | 0.000 | 0.000 | 0.693 | 0.000 | ||
| 2 spectra, EPFGTEGR | 0.000 | 0.002 | 0.248 | 0.000 | 0.000 | 0.100 | 0.649 | 0.000 | ||
| 2 spectra, VQPNEAVYTK | 0.000 | 0.000 | 0.200 | 0.000 | 0.000 | 0.000 | 0.800 | 0.000 | ||
| 1 spectrum, VTPEERPK | 0.000 | 0.015 | 0.299 | 0.000 | 0.000 | 0.000 | 0.686 | 0.000 | ||
| 1 spectrum, DGLLPEDTFIVGYAR | 0.000 | 0.056 | 0.259 | 0.000 | 0.000 | 0.000 | 0.685 | 0.000 | ||
| 3 spectra, GPTEADELMK | 0.000 | 0.058 | 0.227 | 0.000 | 0.000 | 0.000 | 0.715 | 0.000 | ||
| 2 spectra, KPGMFFNPEESELDLTYGNR | 0.000 | 0.047 | 0.176 | 0.000 | 0.000 | 0.000 | 0.777 | 0.000 | ||
| 1 spectrum, NIQEICMSQTGWNR | 0.082 | 0.000 | 0.118 | 0.000 | 0.000 | 0.000 | 0.800 | 0.000 | ||
| 1 spectrum, DVAGDIFHQQCK | 0.000 | 0.000 | 0.227 | 0.000 | 0.000 | 0.000 | 0.773 | 0.000 |
| Plot | Mito | Lyso or Perox | ER | Golgi | PM | Cytosol | Nucleus | ||||||
| Expt B |
7 peptides |
15 spectra |
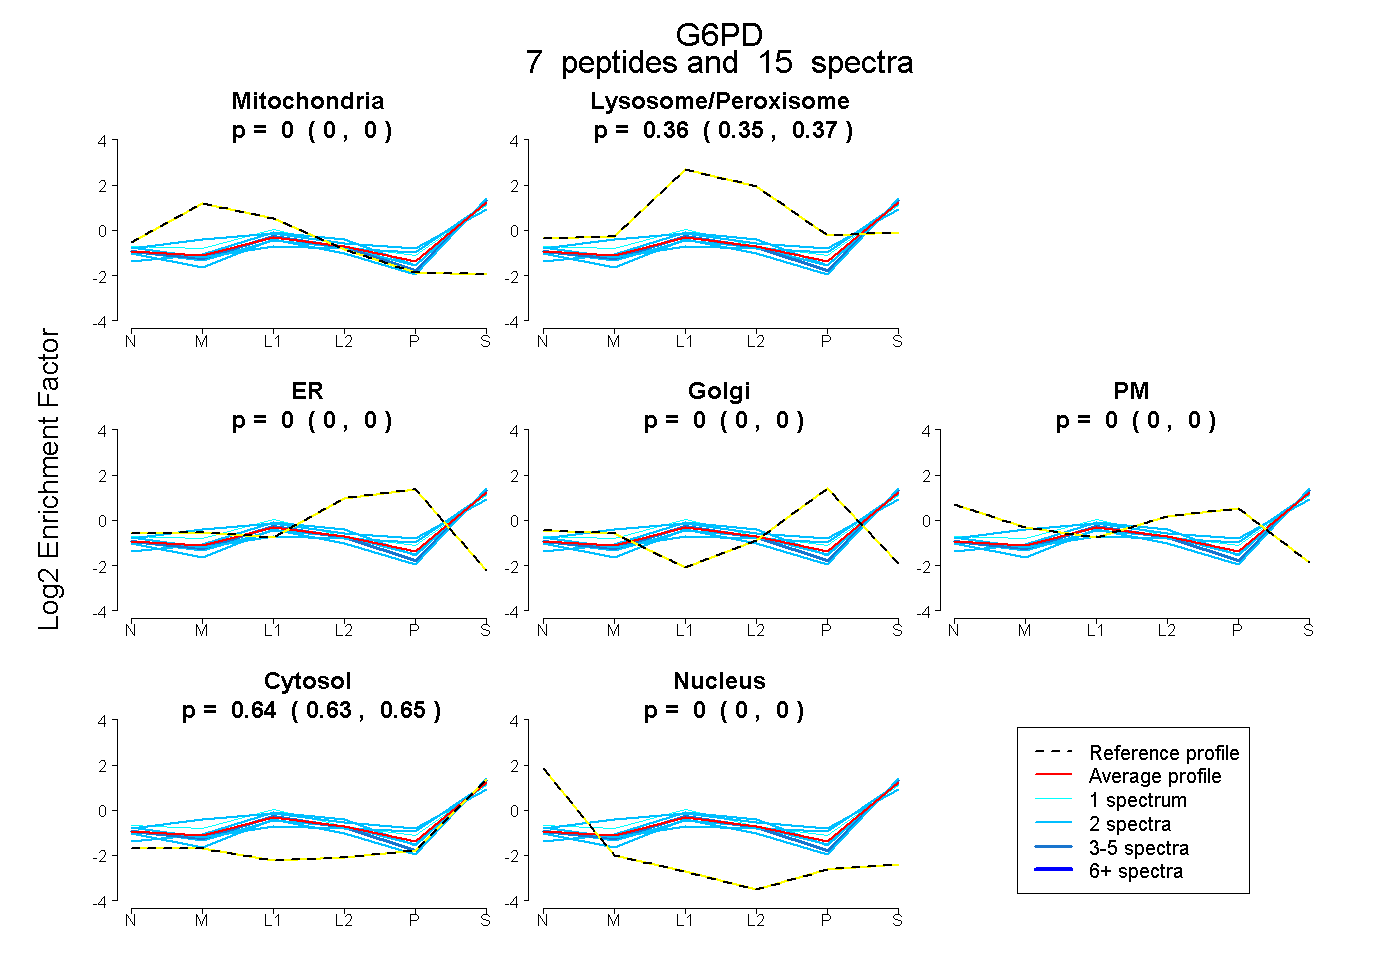 |
0.000 0.000 | 0.000 |
0.360 0.354 | 0.366 |
0.000 0.000 | 0.000 |
0.000 0.000 | 0.000 |
0.000 0.000 | 0.000 |
0.640 0.633 | 0.645 |
0.000 0.000 | 0.000 |
|||
| Plot | Lyso | Other | |||||||||||
| Expt C |
24 peptides |
133 spectra |
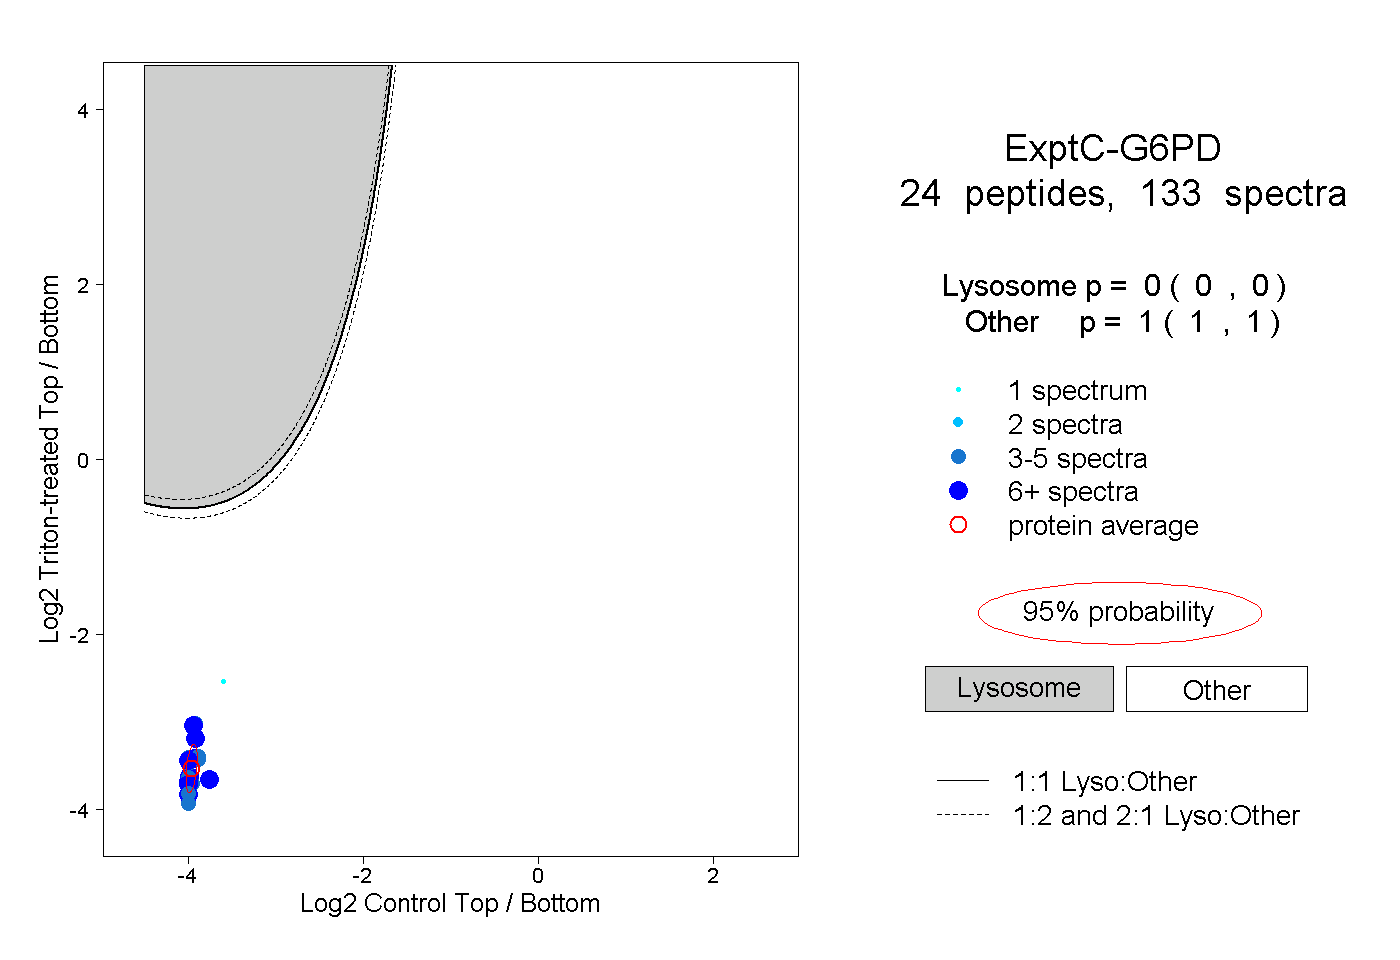 |
0.000 0.000 | 0.000 |
1.000 1.000 | 1.000 |
||||||||
| Plot | Lyso | Other | |||||||||||
| Expt D |
4 peptides |
11 spectra |
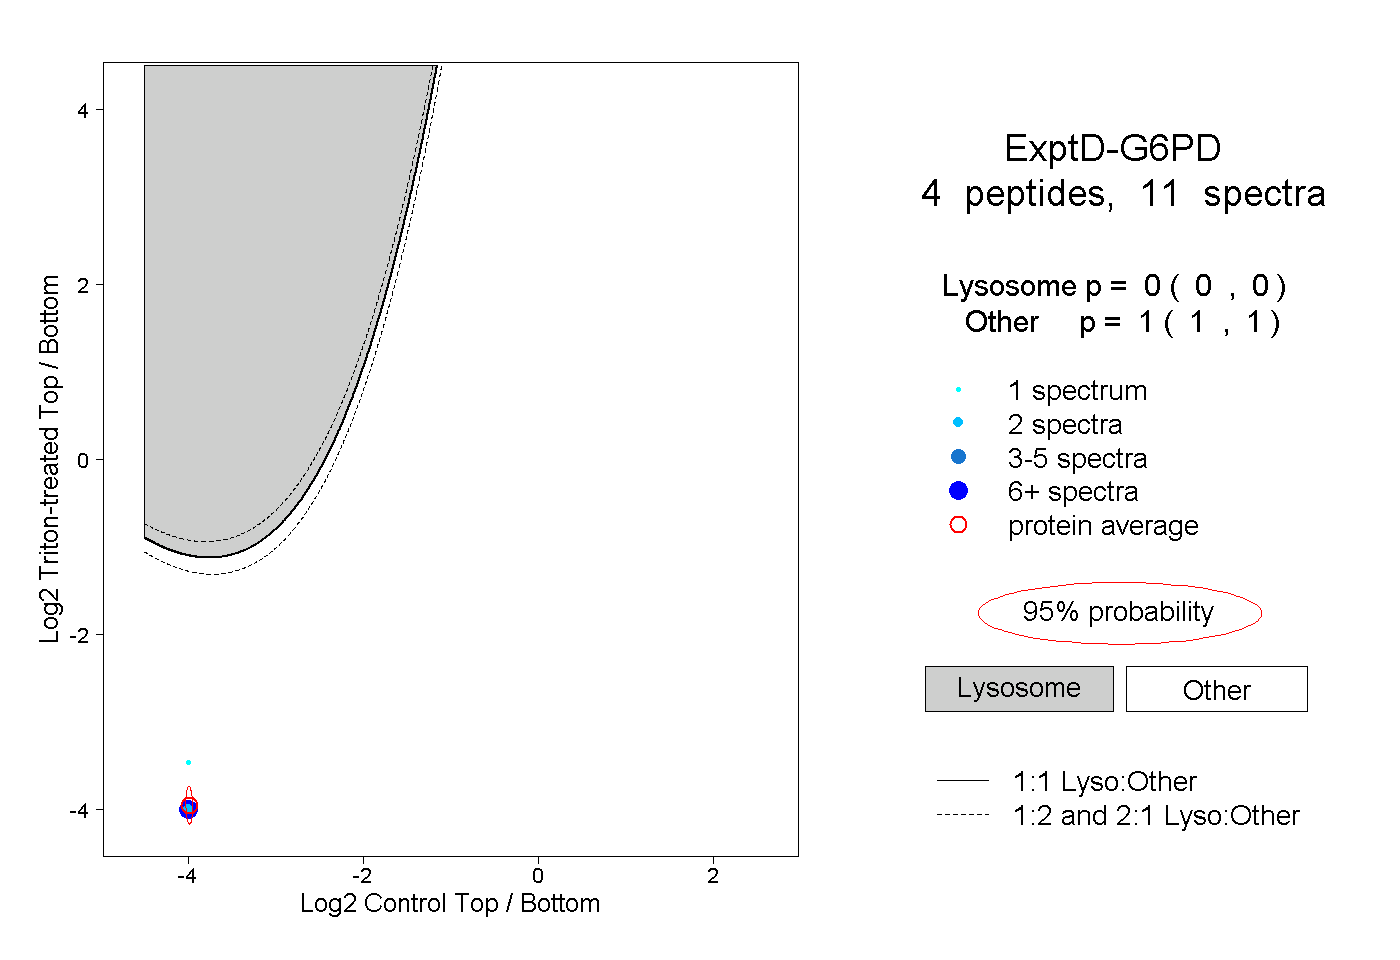 |
0.000 0.000 | 0.000 |
1.000 1.000 | 1.000 |