 3
3peptides
spectra
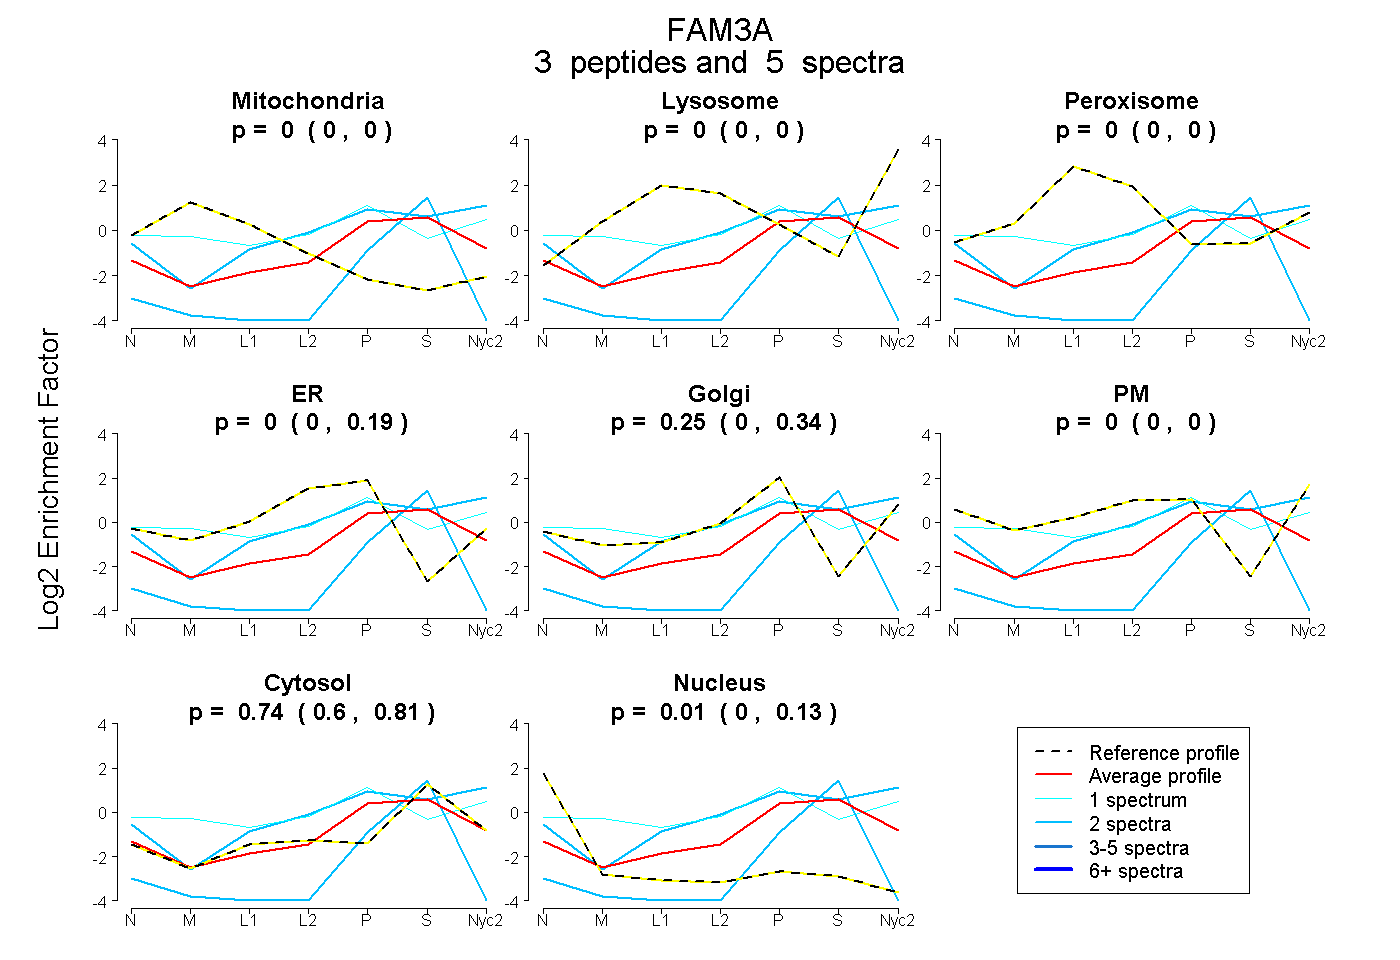
0.000 | 0.000
0.000 | 0.000
0.000 | 0.000
0.000 | 0.190
0.000 | 0.345
0.000 | 0.000
0.604 | 0.808
0.000 | 0.127
2peptides
spectra
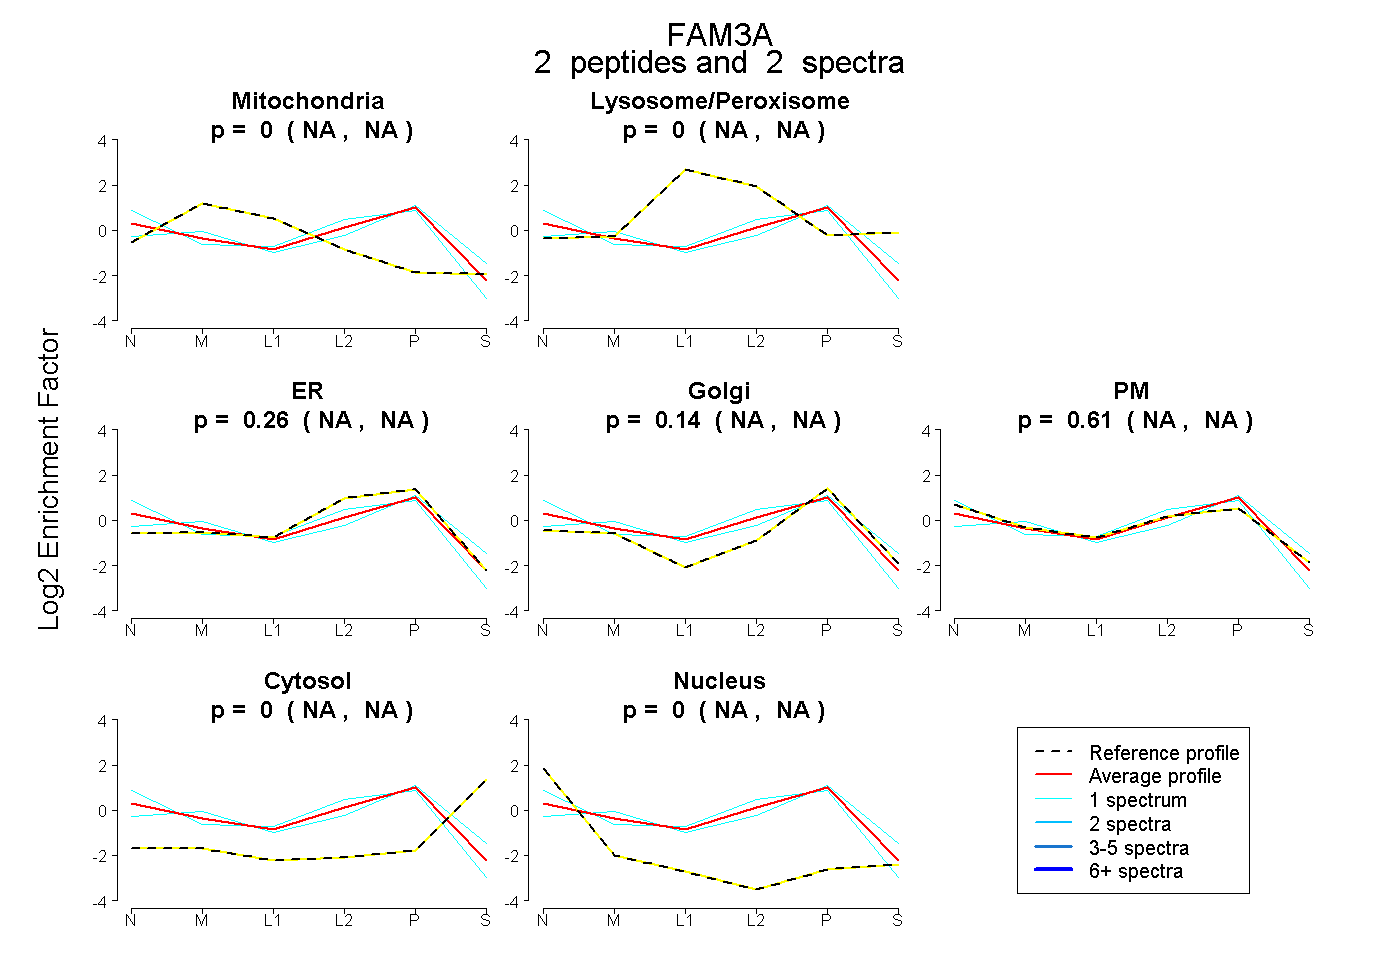
NA | NA
NA | NA
NA | NA
NA | NA
NA | NA
NA | NA
NA | NA
| Plot | Mito | Lyso | Perox | ER | Golgi | PM | Cytosol | Nucleus | |||||
| Expt A |
3 peptides |
5 spectra |
|
0.000 0.000 | 0.000 |
0.000 0.000 | 0.000 |
0.000 0.000 | 0.000 |
0.000 0.000 | 0.190 |
0.252 0.000 | 0.345 |
0.000 0.000 | 0.000 |
0.742 0.604 | 0.808 |
0.006 0.000 | 0.127 |
||
| Plot | Mito | Lyso or Perox | ER | Golgi | PM | Cytosol | Nucleus | ||||||
| Expt B |
2 peptides |
2 spectra |
|
0.000 NA | NA |
0.000 NA | NA |
0.256 NA | NA |
0.136 NA | NA |
0.608 NA | NA |
0.000 NA | NA |
0.000 NA | NA |
| 1 spectrum, LGAPLR | 0.000 | 0.000 | 0.311 | 0.000 | 0.659 | 0.000 | 0.031 | |||
| 1 spectrum, LFSELGSR | 0.035 | 0.181 | 0.011 | 0.671 | 0.101 | 0.000 | 0.000 |
| Plot | Lyso | Other | |||||||||||
| Expt C |
3 peptides |
5 spectra |
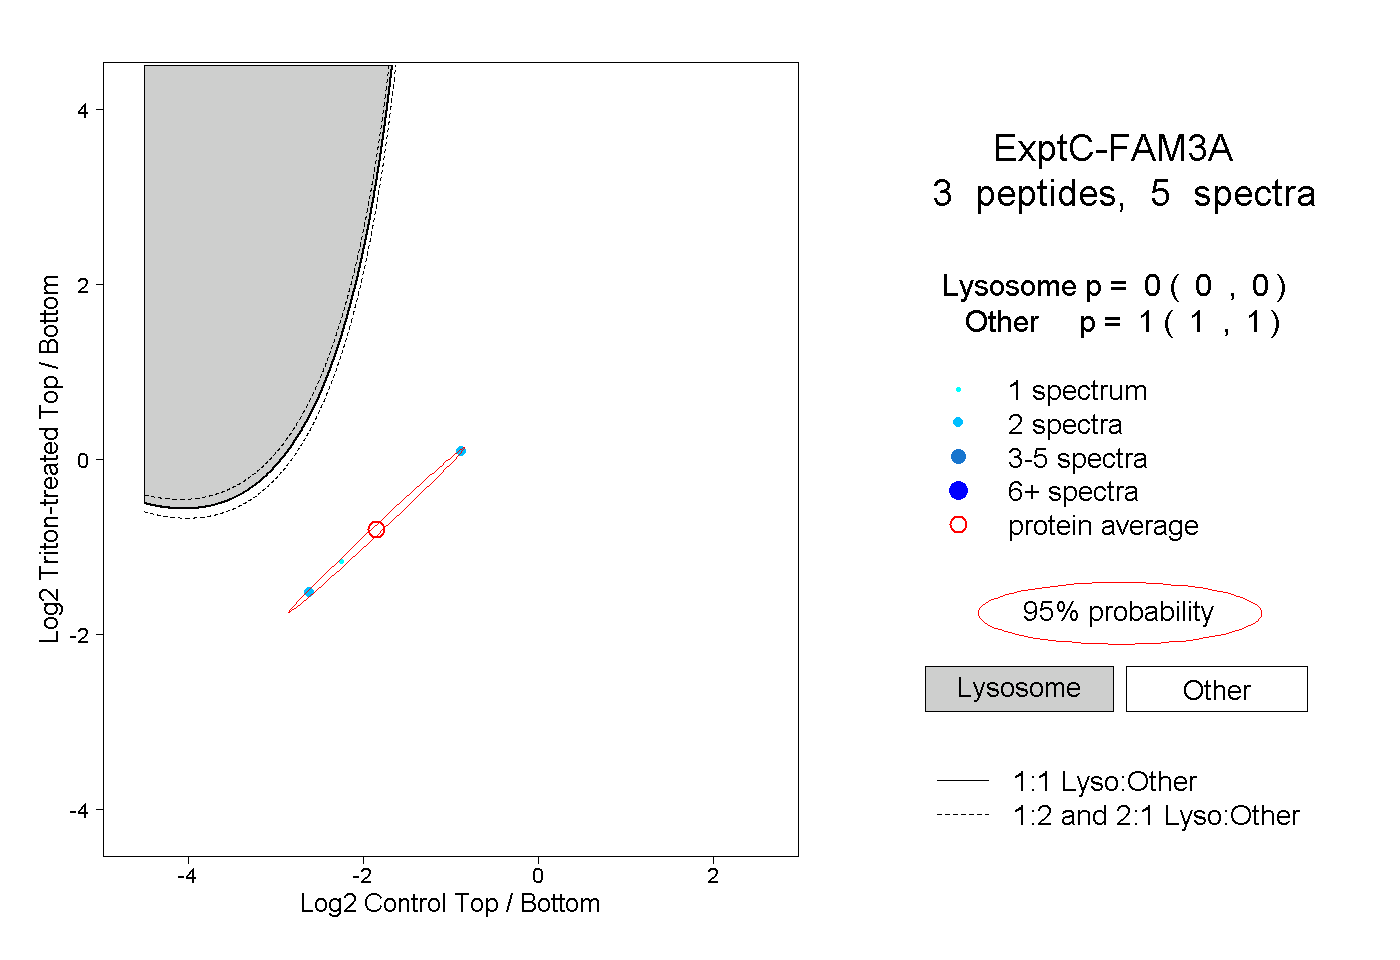 |
0.000 0.000 | 0.000 |
1.000 1.000 | 1.000 |