 2
2peptides
spectra
0.000 | 0.056
0.000 | 0.000
0.000 | 0.000
0.000 | 0.046
0.000 | 0.077
0.000 | 0.000
0.803 | 0.890
0.062 | 0.140
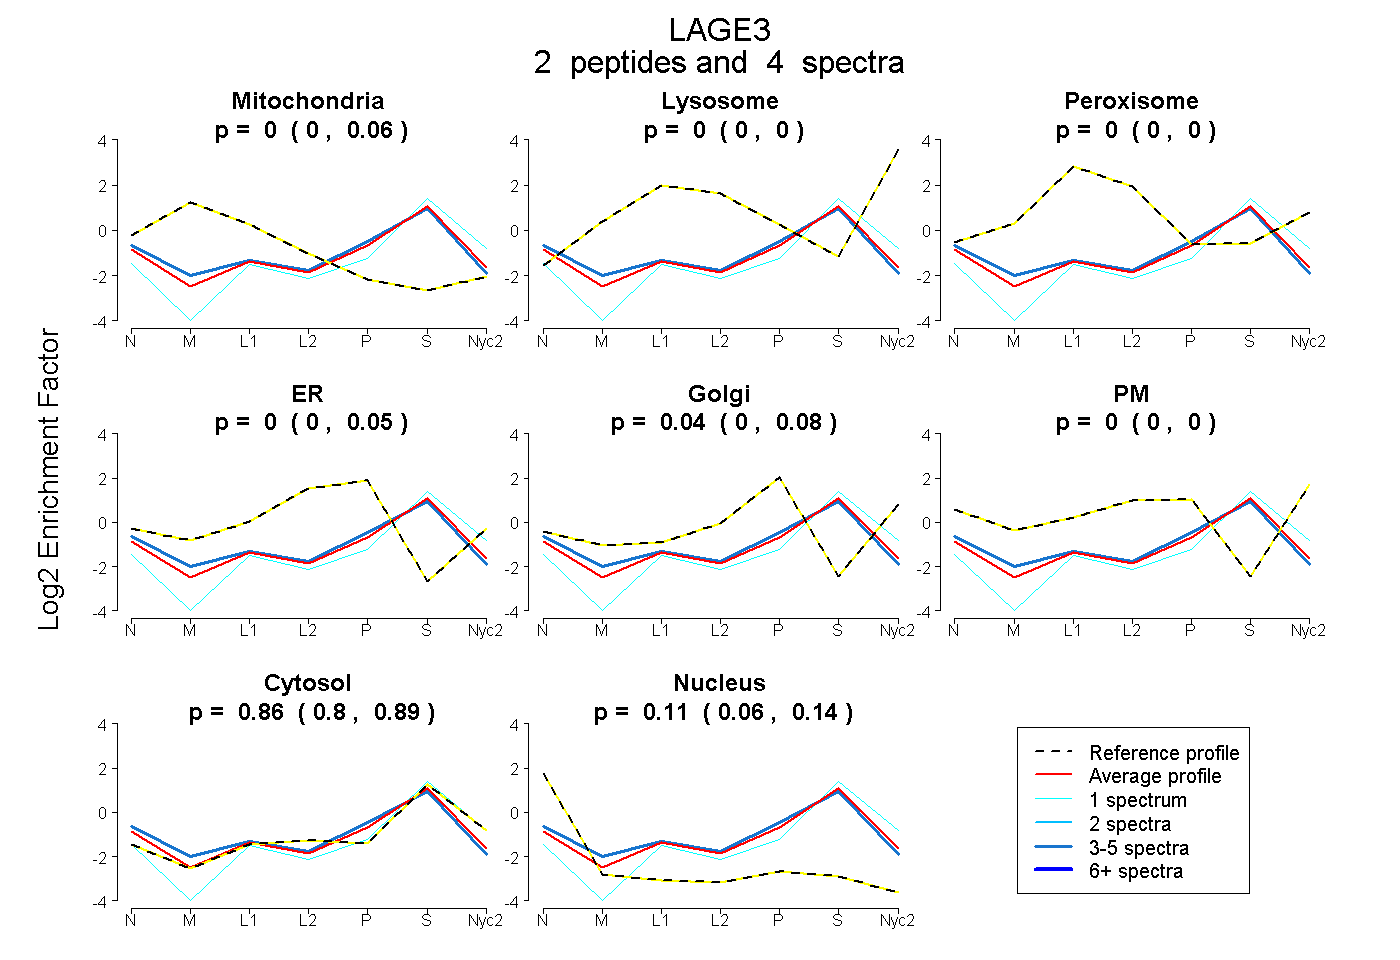
| Plot | Mito | Lyso | Perox | ER | Golgi | PM | Cytosol | Nucleus | |||||
| Expt A |
2 peptides |
4 spectra |
|
0.000 0.000 | 0.056 |
0.000 0.000 | 0.000 |
0.000 0.000 | 0.000 |
0.000 0.000 | 0.046 |
0.037 0.000 | 0.077 |
0.000 0.000 | 0.000 |
0.855 0.803 | 0.890 |
0.108 0.062 | 0.140 |